Fig. 7.
Download original image
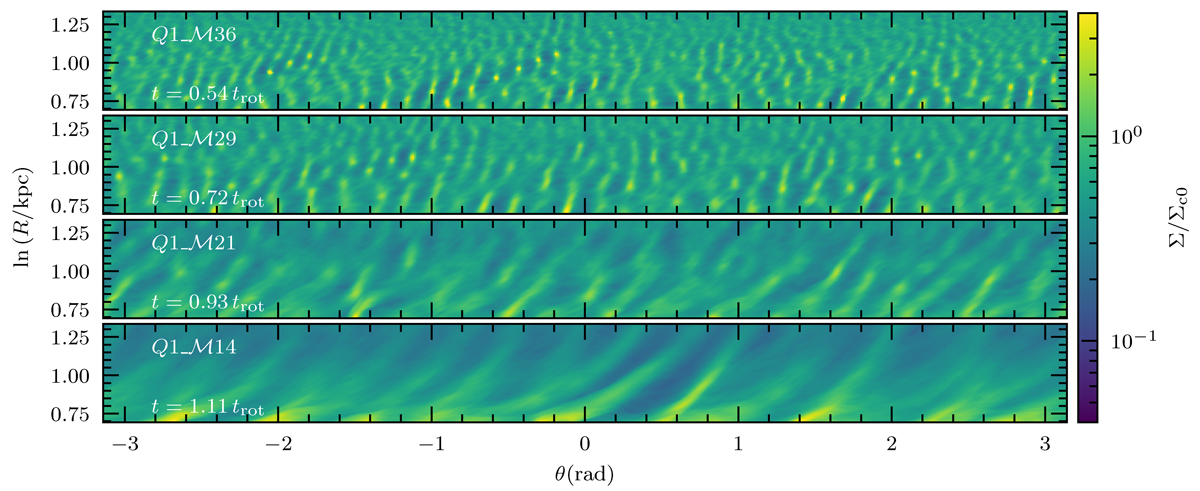
Normalised surface density Σ/Σc0 in the (lnR, θ) plane for the same runs and times as shown in Figure 6. The radial range in this figure is chosen to highlight the annulus from 2 − 4 kpc where feather formation is strongest. We can see the feathers appear as sloped lines that are periodic in azimuth, with length, thickness, orientation and spacing that vary with ℳc. The associated time evolution movies are available online.
Current usage metrics show cumulative count of Article Views (full-text article views including HTML views, PDF and ePub downloads, according to the available data) and Abstracts Views on Vision4Press platform.
Data correspond to usage on the plateform after 2015. The current usage metrics is available 48-96 hours after online publication and is updated daily on week days.
Initial download of the metrics may take a while.