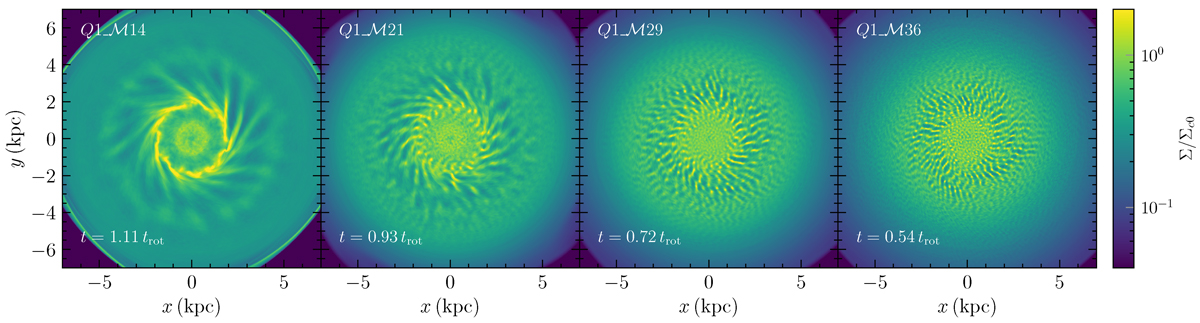
Fig. 6.
Download original image
Same as Figure 4, but now showing the different runs at different times. The time is chosen such that the standard deviation of the logarithmic surface density log10ση = −0.3 in all runs. We see systematic differences in the filament morphology even when the filament forming regions have similar density contrasts. The filaments are large scale and uniform in the ℳc = 14 and 21 runs compared to the more complex and finely spaced in the ℳc = 29 and 36 cases.
Current usage metrics show cumulative count of Article Views (full-text article views including HTML views, PDF and ePub downloads, according to the available data) and Abstracts Views on Vision4Press platform.
Data correspond to usage on the plateform after 2015. The current usage metrics is available 48-96 hours after online publication and is updated daily on week days.
Initial download of the metrics may take a while.