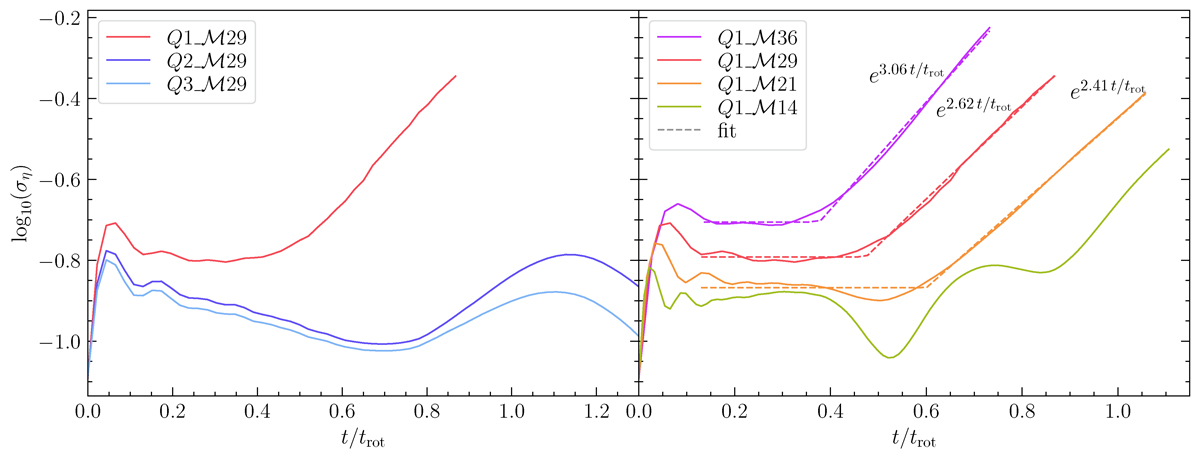
Fig. 5.
Download original image
Time evolution of the variance in the logarithmic surface density, ση, where η is defined in Equation 8. The panel on the left is for runs with varying ⟨Q⟩ and fixed ℳc and the panel on the right for runs with varying ℳc but fixed ⟨Q⟩, as indicated in the legends. The solid lines represent the simulation data and the dotted lines are piecewise fits with a constant and an exponential part. We see that the ⟨Q⟩> 1 runs are stable, while there is exponential growth in all the runs with ⟨Q⟩ = 1. For the unstable runs, we see that growth is faster for higher ℳc. We also observe a decrease in the time of the onset of the instability with increasing ℳc. We do not provide an analytical fit to the ℳc = 14 case because of its complex behaviour.
Current usage metrics show cumulative count of Article Views (full-text article views including HTML views, PDF and ePub downloads, according to the available data) and Abstracts Views on Vision4Press platform.
Data correspond to usage on the plateform after 2015. The current usage metrics is available 48-96 hours after online publication and is updated daily on week days.
Initial download of the metrics may take a while.