Open Access
Fig. 2.
Download original image
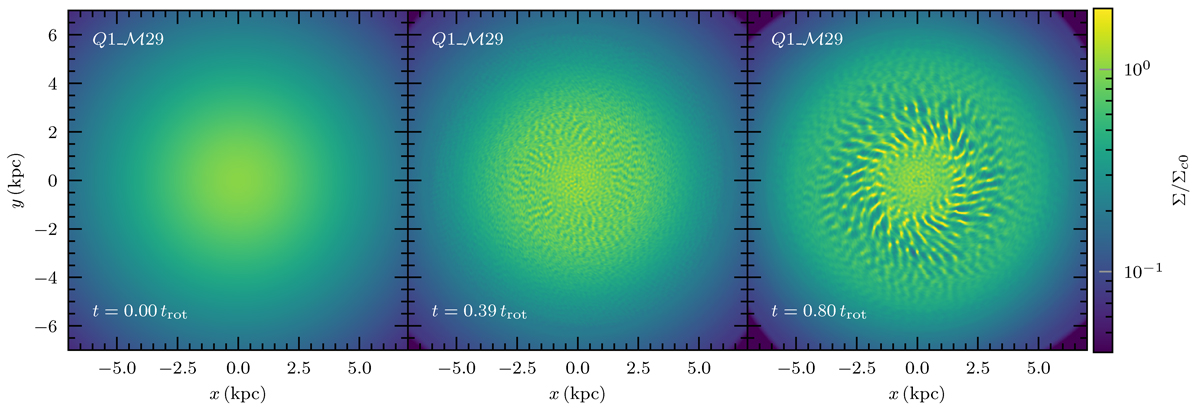
Projected density of the Q1_ℳ29 model in the z-plane. The projected density is normalised by the initial central projected density of the galaxy, shown at 0, 0.4, and 0.8 rotational times (trot), from left to right. We see the gradual emergence of filamentary structures around R = 2–4 kpc.
Current usage metrics show cumulative count of Article Views (full-text article views including HTML views, PDF and ePub downloads, according to the available data) and Abstracts Views on Vision4Press platform.
Data correspond to usage on the plateform after 2015. The current usage metrics is available 48-96 hours after online publication and is updated daily on week days.
Initial download of the metrics may take a while.