Open Access
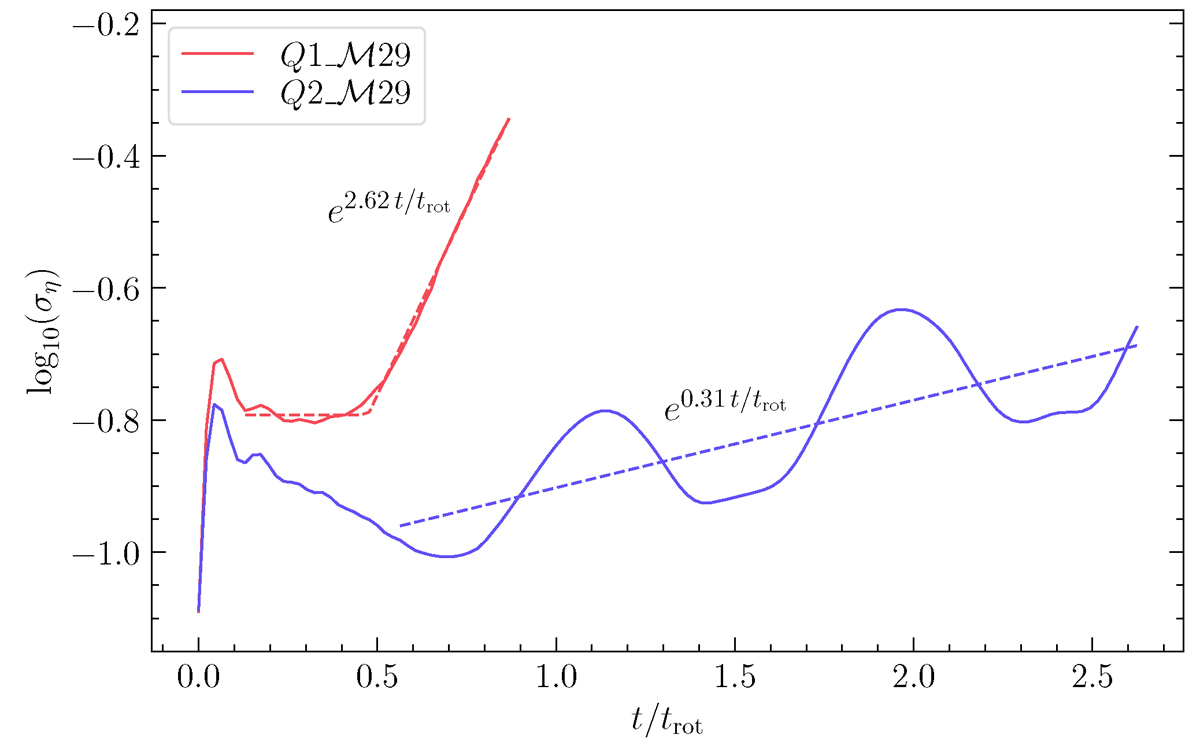
Fig. C.2.
Download original image
Same as Figure 5, but only for Q1_ℳ29 and Q2_ℳ29 runs, where the latter was evolved to a later time than shown in the main text. We see the oscillatory peaks in the Q = 2 run, but also a steady, yet slow growth over time. This growth is visibly smaller than in the Q1_ℳ29 run.
Current usage metrics show cumulative count of Article Views (full-text article views including HTML views, PDF and ePub downloads, according to the available data) and Abstracts Views on Vision4Press platform.
Data correspond to usage on the plateform after 2015. The current usage metrics is available 48-96 hours after online publication and is updated daily on week days.
Initial download of the metrics may take a while.