Open Access
Fig. C.1.
Download original image
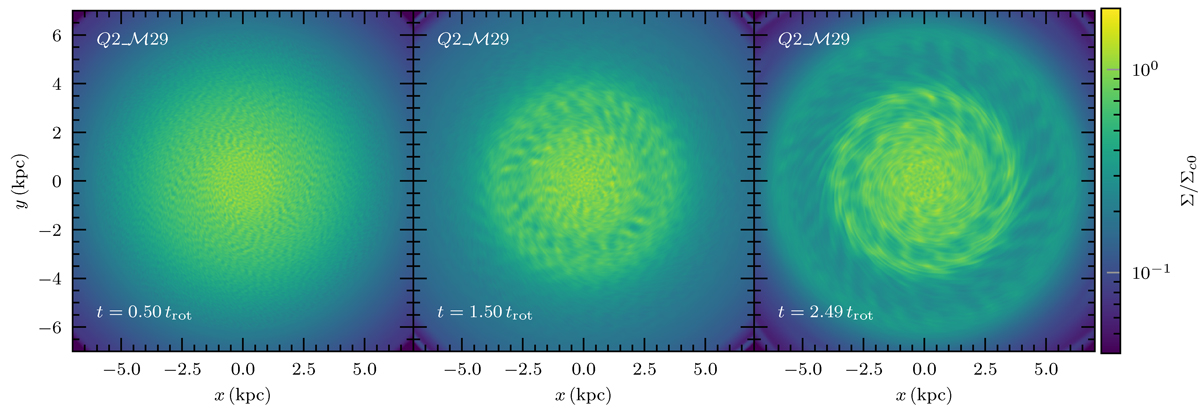
Same as Figure 2, but for the longer time evolution of the Q = 2 run. We see that there are faint structures at early times in the first two panels. The third panel shows a structure with somewhat more density contrast, visually confirming the slow growth of an instability.
Current usage metrics show cumulative count of Article Views (full-text article views including HTML views, PDF and ePub downloads, according to the available data) and Abstracts Views on Vision4Press platform.
Data correspond to usage on the plateform after 2015. The current usage metrics is available 48-96 hours after online publication and is updated daily on week days.
Initial download of the metrics may take a while.