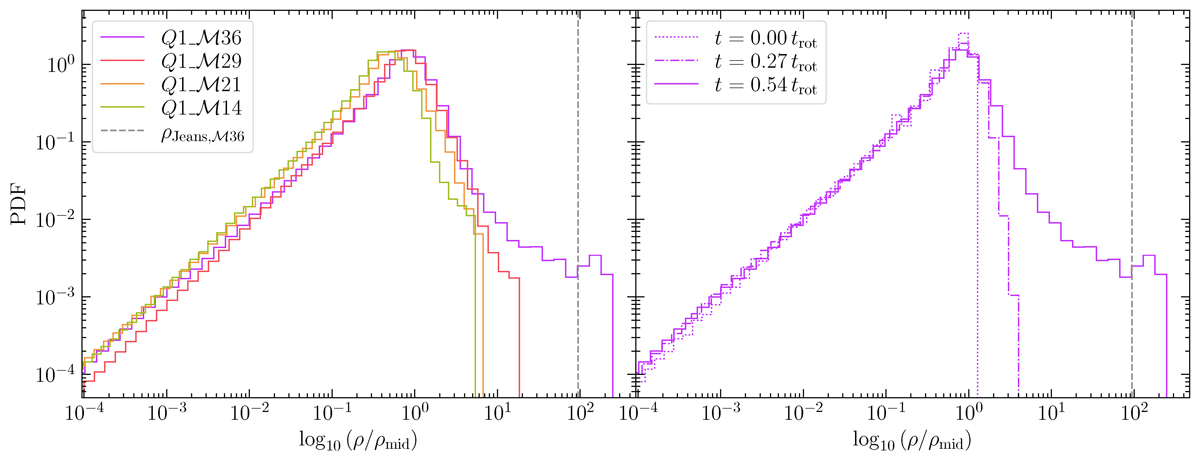
Fig. 13.
Download original image
Mass-weighted probability density function (PDF) of the log10 of the density normalised by the radially averaged mid-plane density, for the snapshots shown in Figure 7. The grey dashed line depicts the Jeans density (see text for details), at which we expect numerical effects to dominate. The left panel shows all the runs at times similar to Figure 7, and the right panel shows the time evolution of the Q1_ℳ36 case leading up to the time in the left panel. We see that all the runs in the left panel form high-density tails that represent feathers and that the densest end of the tail is reaching the limit imposed by the resolution of our simulations.
Current usage metrics show cumulative count of Article Views (full-text article views including HTML views, PDF and ePub downloads, according to the available data) and Abstracts Views on Vision4Press platform.
Data correspond to usage on the plateform after 2015. The current usage metrics is available 48-96 hours after online publication and is updated daily on week days.
Initial download of the metrics may take a while.