Fig. 12.
Download original image
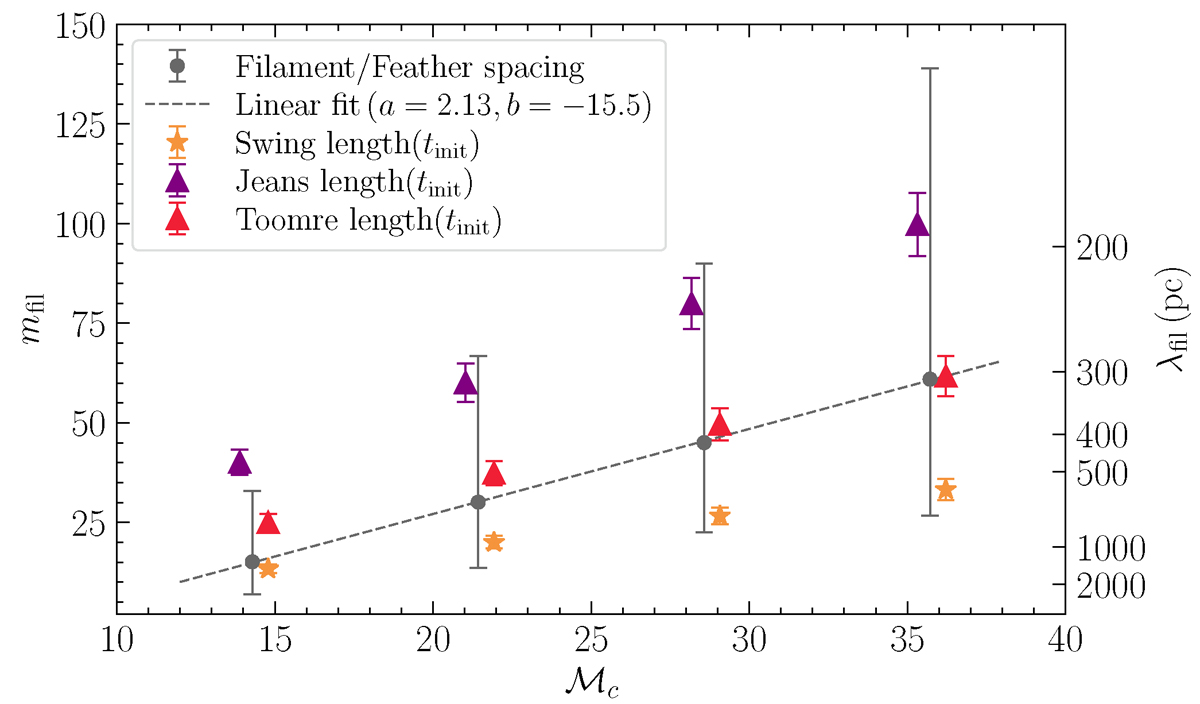
Azimuthal mode of the filaments (mfil) and various instabilities, shown with the ℳc ( ∼ vc/σ) of our galaxies. Black circular points with error bars show the mean and 16th to 84th percentile range of the mfil and corresponding physical spacing λfil for the snapshots shown in Figure 7. The dashed line is a linear fit to the median values of mfil (Equation (13)). Purple, red, and orange points with error bars represent the radial averages ⟨λ⟩ and standard deviations σλ (Equation (14) and Equation (15)) of the wavelength of the most unstable Toomre mode, the Jeans length and the Swing amplification length – see main text for details. These points are slightly offset from their overlapping ℳc values for visibility. The simulations show an increase in the median value of mfil and a broadening of the 16th to 84th percentile range with increasing ℳc. The median filament spacing agrees well with the Toomre length of the ℳc = 21, 29 and 36 runs, and with the swing length for ℳc = 14 run.
Current usage metrics show cumulative count of Article Views (full-text article views including HTML views, PDF and ePub downloads, according to the available data) and Abstracts Views on Vision4Press platform.
Data correspond to usage on the plateform after 2015. The current usage metrics is available 48-96 hours after online publication and is updated daily on week days.
Initial download of the metrics may take a while.