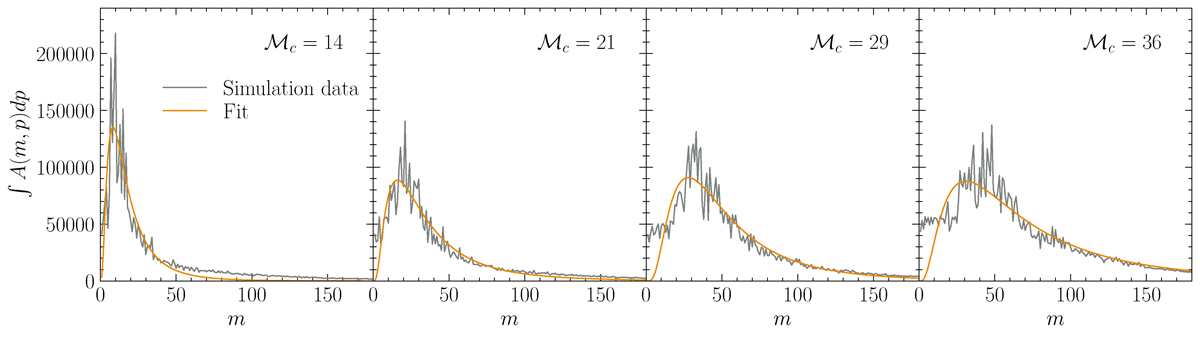
Fig. 11.
Download original image
Amplitude of the 2D Fourier transform A(m, p) of the logarithmic surface density (see Equation (10)) in the region 2–4 kpc, integrated over p. Different panels are for runs with ⟨Q⟩ = 1 and varying ℳc, evaluated at the same times as in Figure 6. The grey curves are simulation data and the orange ones are the empirical fits to the data (see text for details). We can see how the power shifts toward higher values of m with increasing ℳc.
Current usage metrics show cumulative count of Article Views (full-text article views including HTML views, PDF and ePub downloads, according to the available data) and Abstracts Views on Vision4Press platform.
Data correspond to usage on the plateform after 2015. The current usage metrics is available 48-96 hours after online publication and is updated daily on week days.
Initial download of the metrics may take a while.