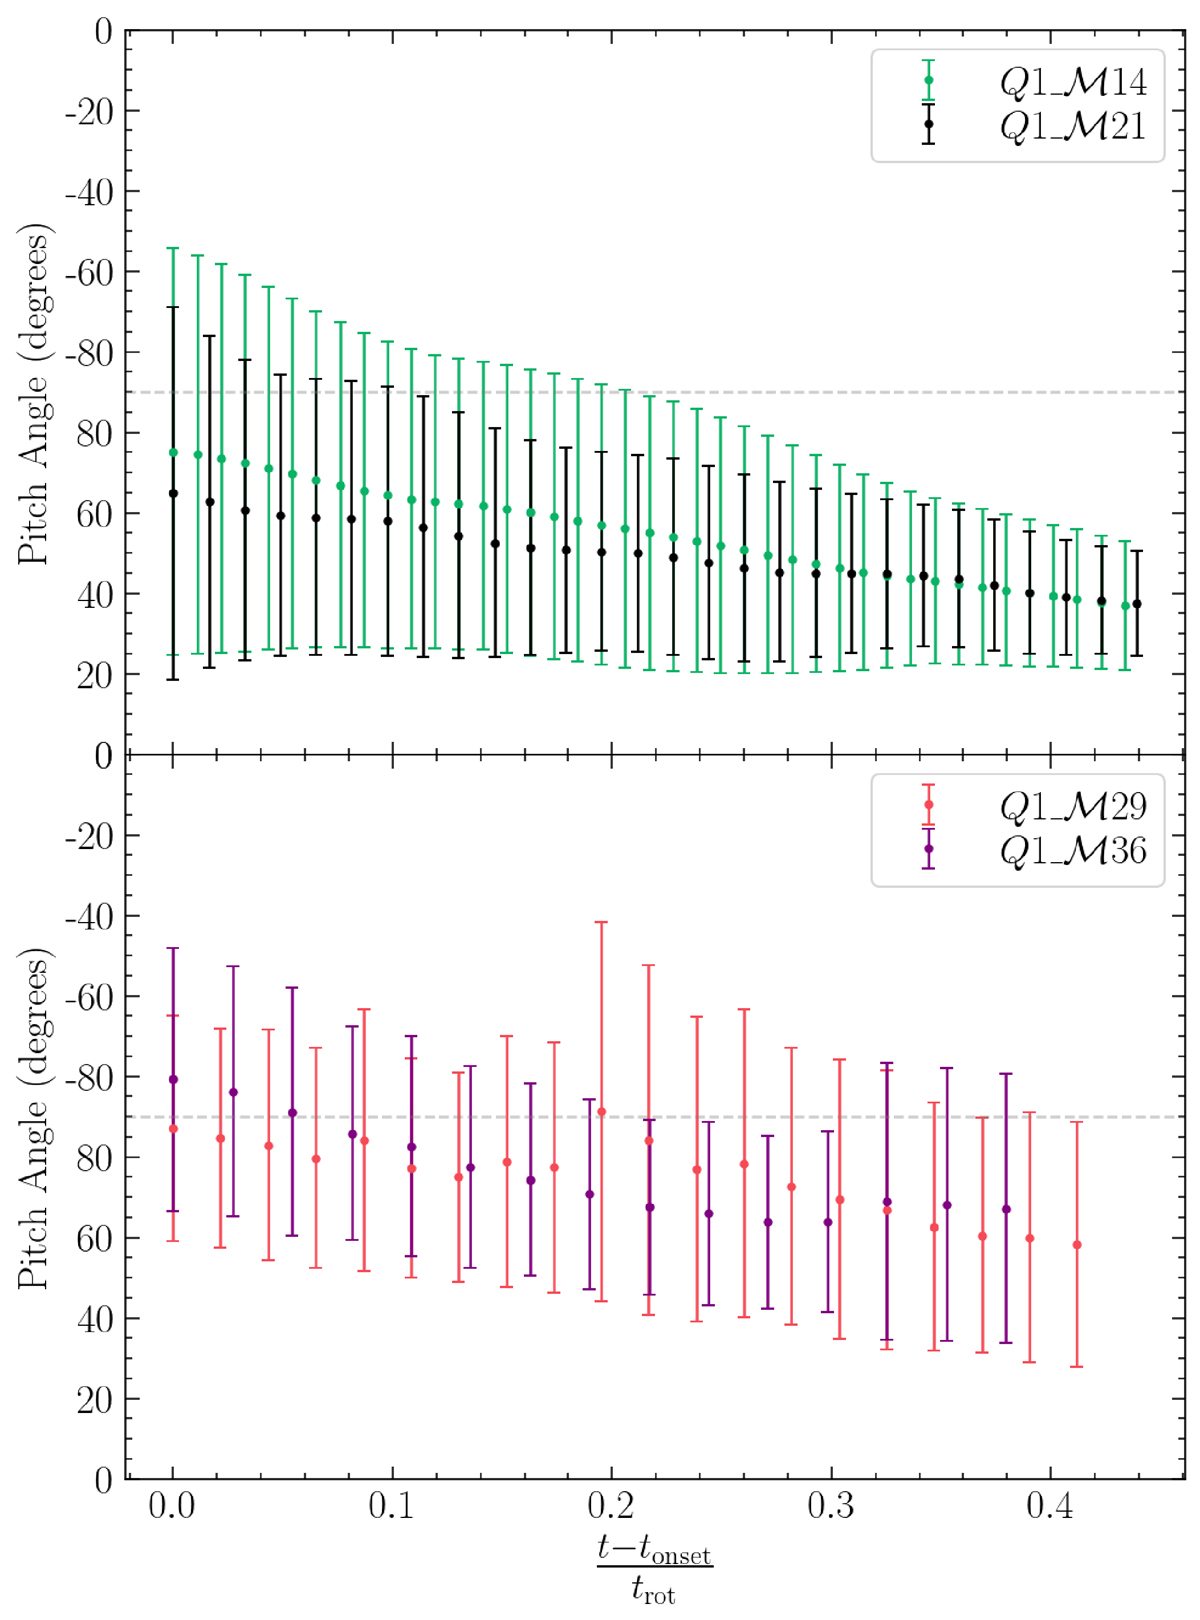
Fig. 10.
Download original image
Time evolution of the pitch angle, α = tan−1(−m/p), of the filaments in the runs with ⟨Q⟩ = 1 and varying ℳc. The upper panel shows the ℳc = 14 and 21 runs, and the lower shows ℳc = 29 and 36. All panels show results after the onset of the instability, and all times are normalised by the rotation period of the galaxy at R = 3 kpc. Circular points represent the mean pitch angle and error bars show the standard deviation. The dashed line shows α = 90°, that marks the transition between the trailing spirals with a positive pitch angles to leading spiral with negative ones. We see that all the runs show a decreasing trend in the pitch angle as the feathers get sheared due to differential rotation of the galaxy.
Current usage metrics show cumulative count of Article Views (full-text article views including HTML views, PDF and ePub downloads, according to the available data) and Abstracts Views on Vision4Press platform.
Data correspond to usage on the plateform after 2015. The current usage metrics is available 48-96 hours after online publication and is updated daily on week days.
Initial download of the metrics may take a while.