Fig. 8
Download original image
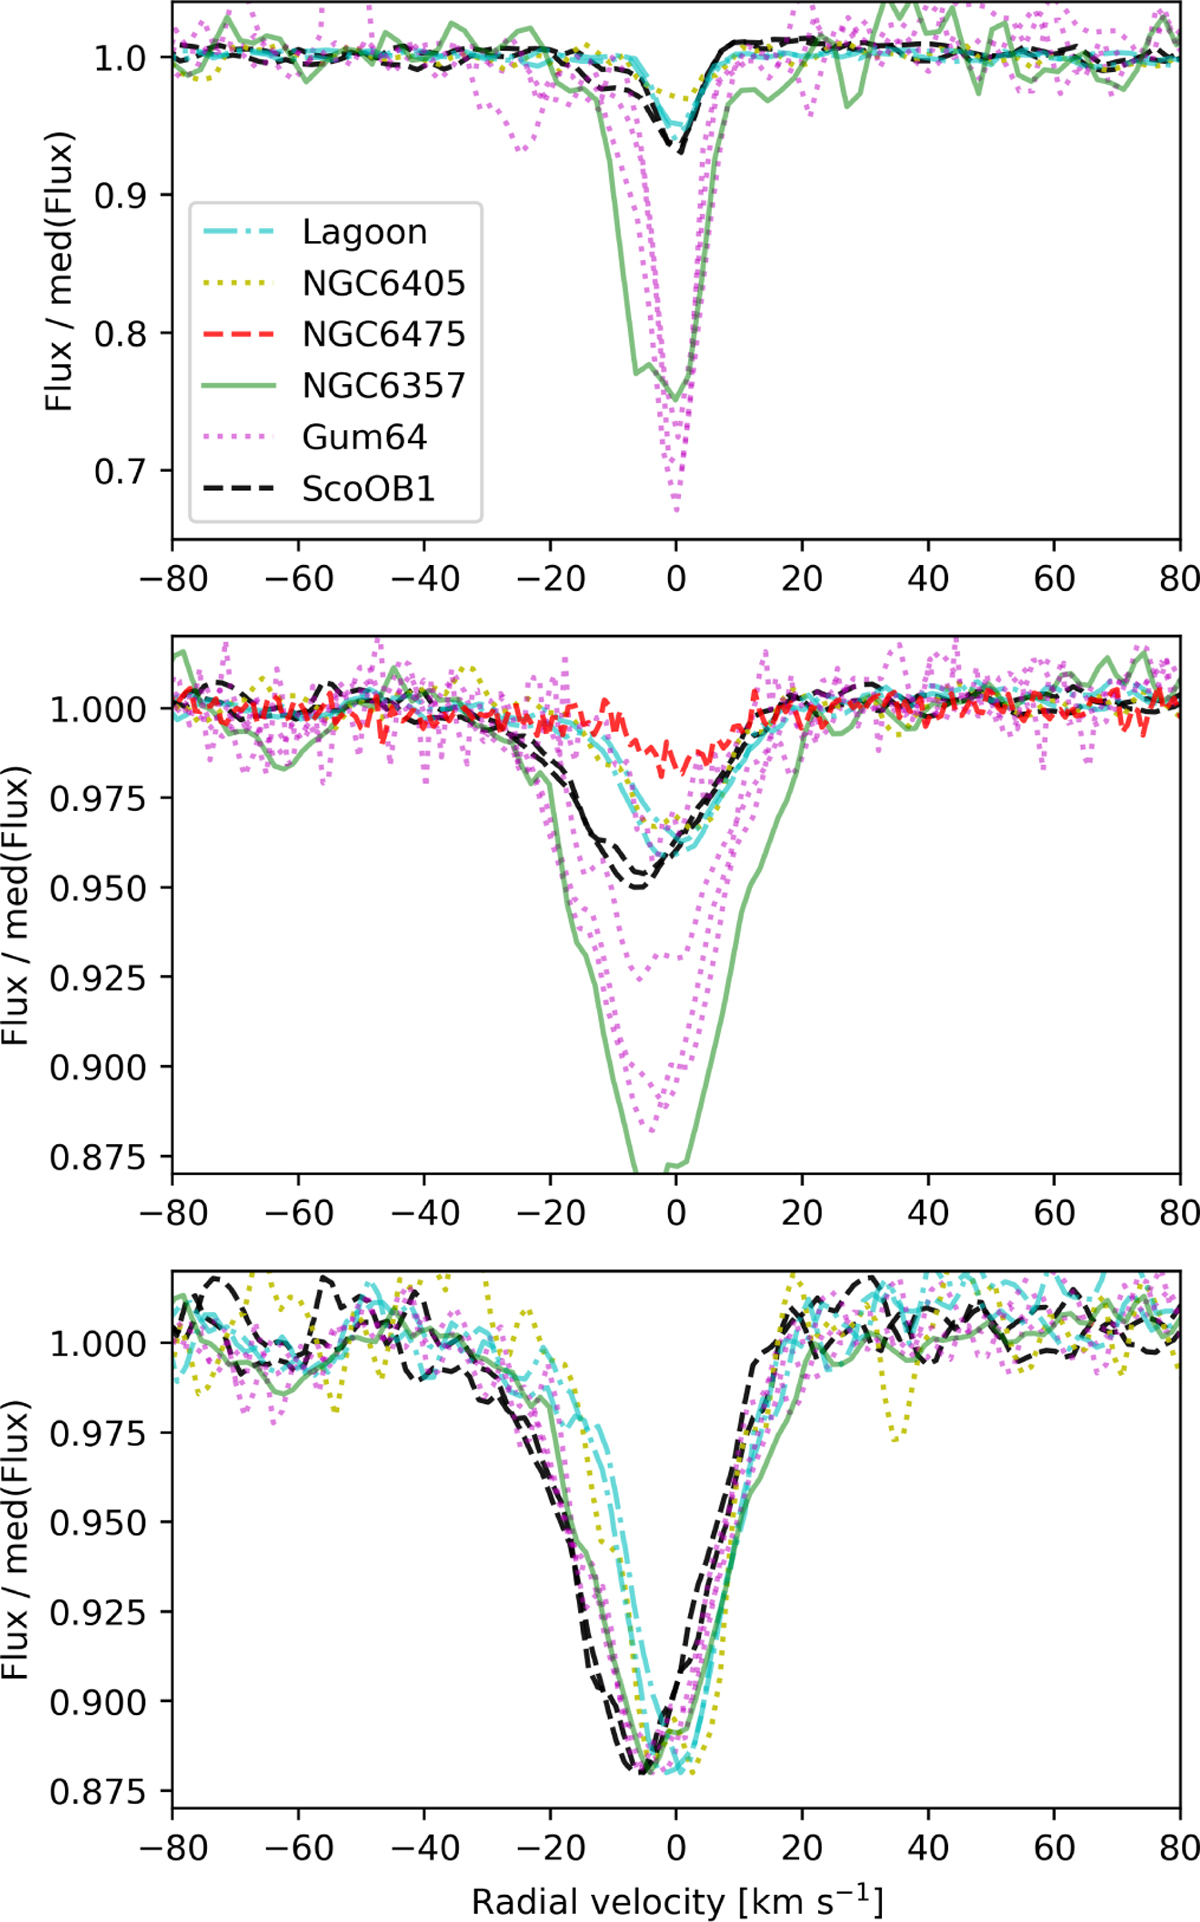
Same as Fig. 5 but for the Lagoon region. Wavelengths were shifted to the rest position of CH* (top panel). Middle panel includes a UVES spectrum of the nearby star HD 156369 (low intensity, magenta dotted line) as an example of a very narrow DIB profile. HD 162780 (red dashed line) is also included, but the rest wavelength could only be estimated from the optical sodium doublet line.
Current usage metrics show cumulative count of Article Views (full-text article views including HTML views, PDF and ePub downloads, according to the available data) and Abstracts Views on Vision4Press platform.
Data correspond to usage on the plateform after 2015. The current usage metrics is available 48-96 hours after online publication and is updated daily on week days.
Initial download of the metrics may take a while.