Fig. 5
Download original image
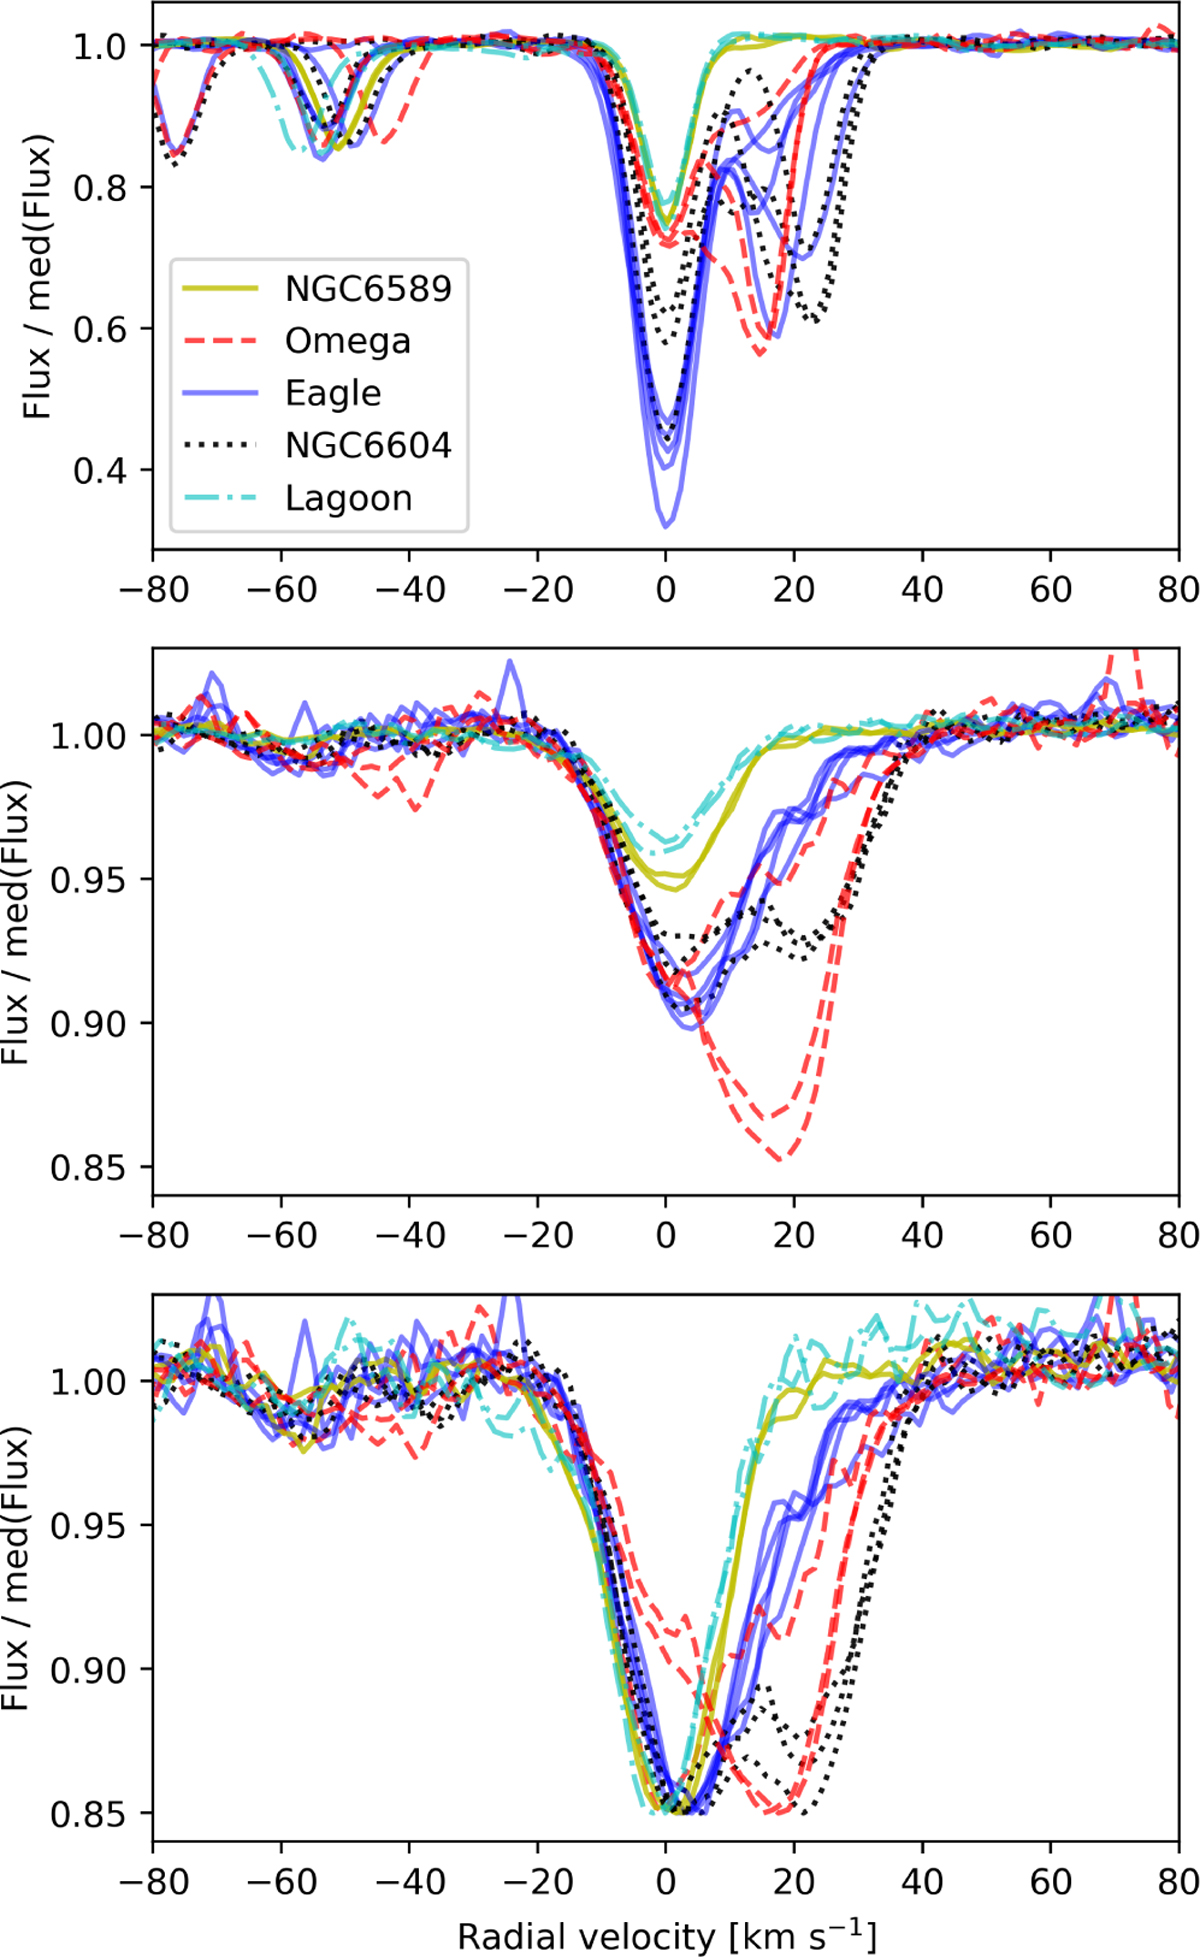
FEROS spectra of targets in the Eagle region and the Lagoon Nebula. Wavelengths were shifted to the rest position of the K I line (top) component corresponding to the motion of the local ISM. The middle panel shows the profile of the 6196 Å DIB. The bottom panel shows the same feature with intensities scaled to the same line depth. Continuum normalisation was not applied when producing this figure the fluxes were only re-scaled using the median of the flux within 5 Å from the shown features.
Current usage metrics show cumulative count of Article Views (full-text article views including HTML views, PDF and ePub downloads, according to the available data) and Abstracts Views on Vision4Press platform.
Data correspond to usage on the plateform after 2015. The current usage metrics is available 48-96 hours after online publication and is updated daily on week days.
Initial download of the metrics may take a while.