Open Access
Fig. D.11
Download original image
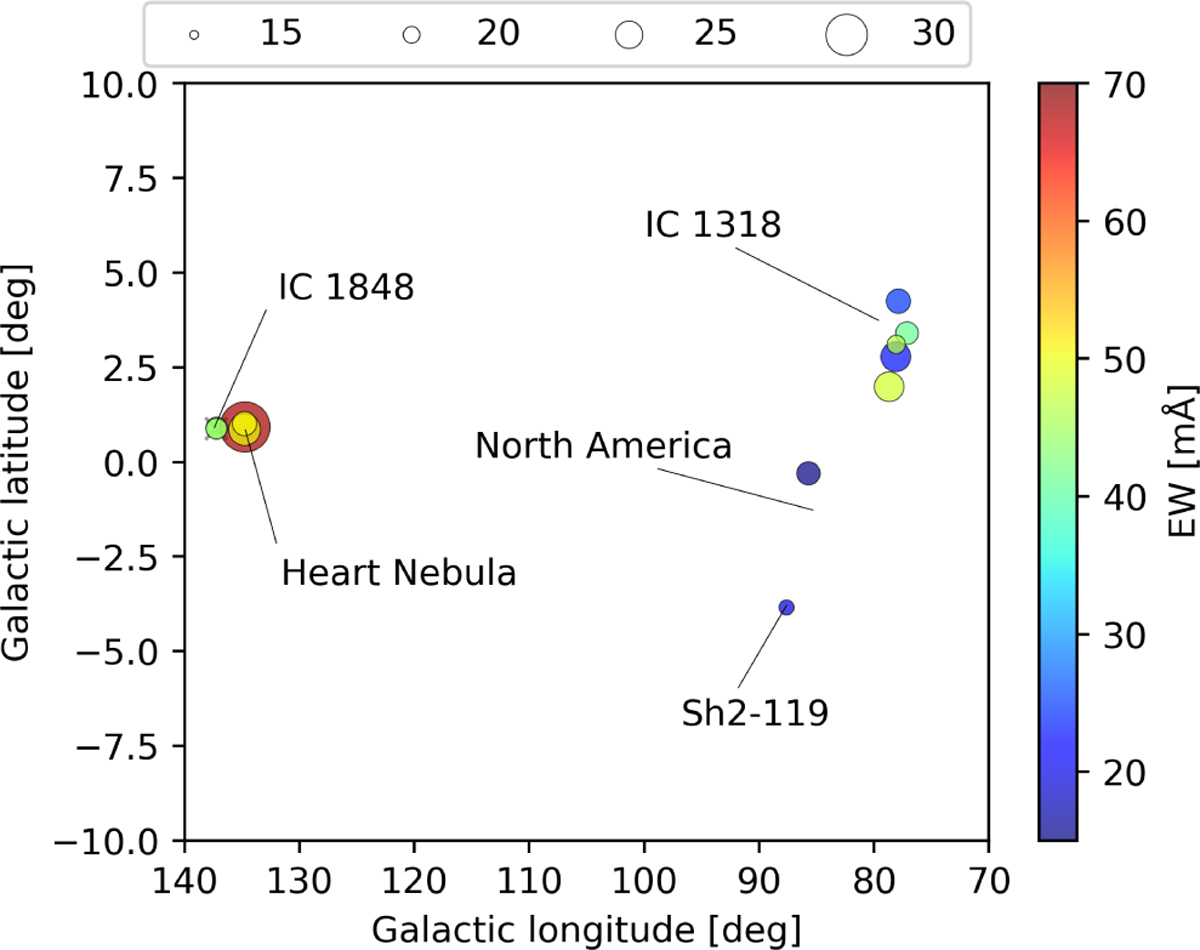
Sky map of the targets within the Heart and Sadr regions. The size of a data point indicates the measured FWHM (values in km s−1), while the colour indicates the strength of the DIB. The most prominent groups of stars are highlighted. Grey crosses indicate stars located within 300 pc from the Sun.
Current usage metrics show cumulative count of Article Views (full-text article views including HTML views, PDF and ePub downloads, according to the available data) and Abstracts Views on Vision4Press platform.
Data correspond to usage on the plateform after 2015. The current usage metrics is available 48-96 hours after online publication and is updated daily on week days.
Initial download of the metrics may take a while.