Fig. C.1
Download original image
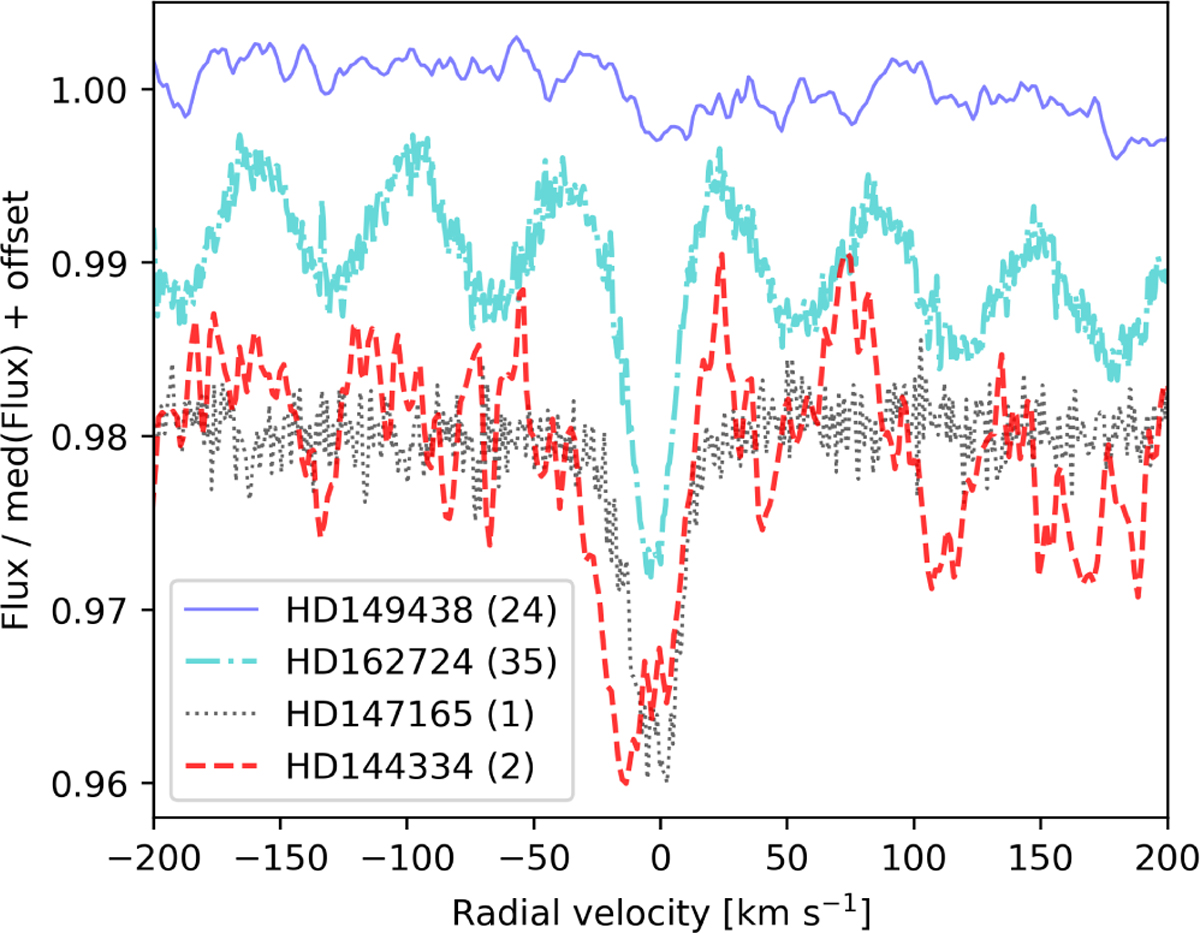
Similar to Fig. 5 but only showing the profile of the DIB. Wavelengths were shifted to the rest position of the Na I line, except for HD 147165 where K I was used. The profiles of the DIB towards HD 147165 and HD 144334 are compared by scaling the profiles to the same line depth. The numbers in brackets displayed within the legend correspond to the number of stacked spectra.
Current usage metrics show cumulative count of Article Views (full-text article views including HTML views, PDF and ePub downloads, according to the available data) and Abstracts Views on Vision4Press platform.
Data correspond to usage on the plateform after 2015. The current usage metrics is available 48-96 hours after online publication and is updated daily on week days.
Initial download of the metrics may take a while.