Fig. A.1
Download original image
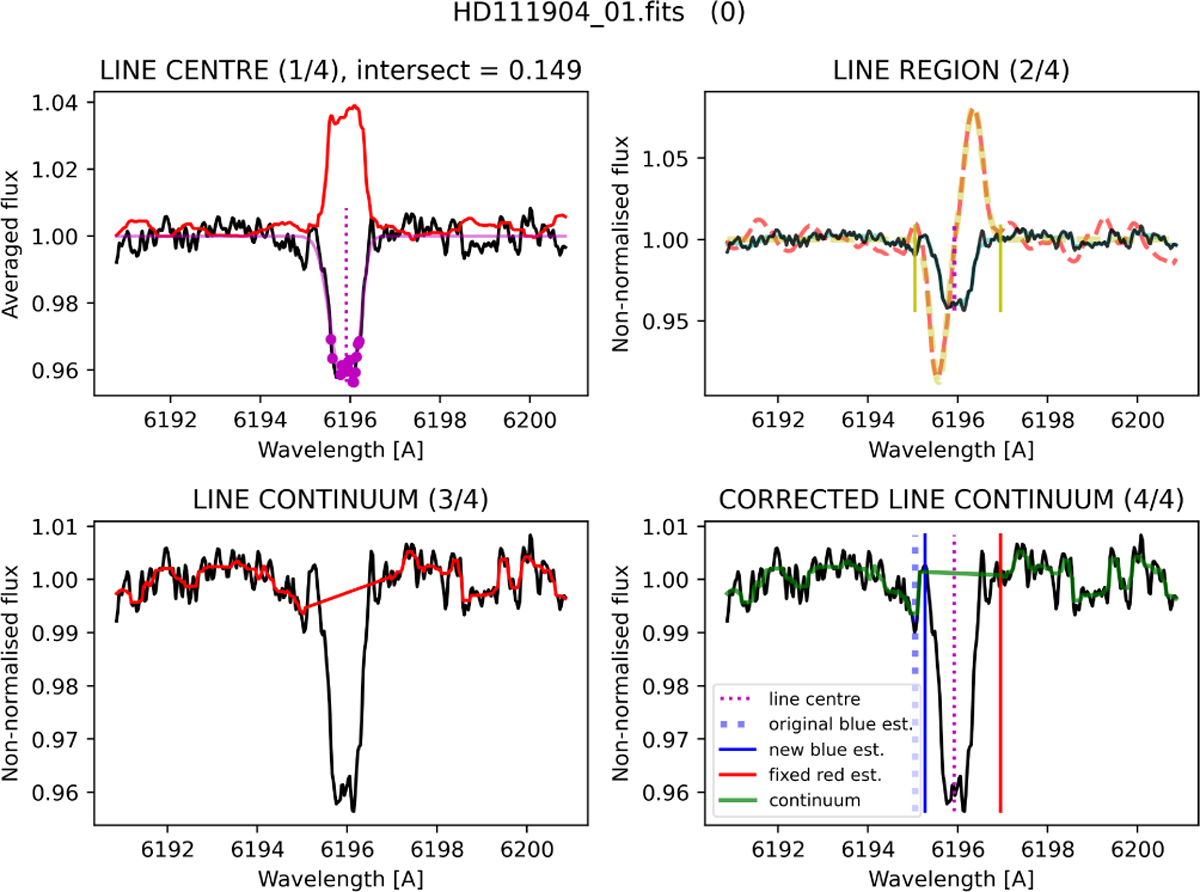
Graphical representation of the intermediate steps of our continuum normalisation procedure. Top-left: roughly stacked spectrum is used to identify the position of the DIB. Top-right: the gradient of the spectrum and the initial estimates of profile end-points. Bottom-left: initial estimate of the continuum. Bottom-right: the final continuum model based on an improved estimate of the blue end-point.
Current usage metrics show cumulative count of Article Views (full-text article views including HTML views, PDF and ePub downloads, according to the available data) and Abstracts Views on Vision4Press platform.
Data correspond to usage on the plateform after 2015. The current usage metrics is available 48-96 hours after online publication and is updated daily on week days.
Initial download of the metrics may take a while.