Open Access
Fig. 2.
Download original image
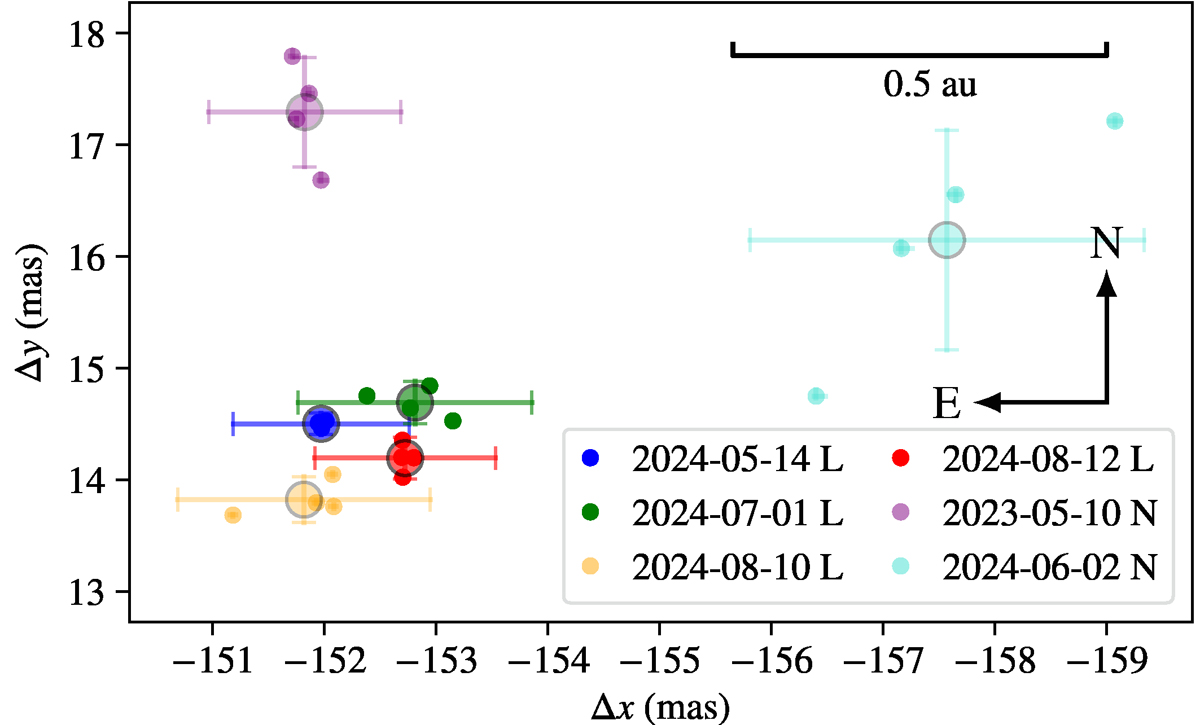
Relative position of the companion, T CrA B, with respect to the central star, shown at the various epochs of our data. The small circles indicate the per-exposure fit results; the large circles show the per-epoch averages.
Current usage metrics show cumulative count of Article Views (full-text article views including HTML views, PDF and ePub downloads, according to the available data) and Abstracts Views on Vision4Press platform.
Data correspond to usage on the plateform after 2015. The current usage metrics is available 48-96 hours after online publication and is updated daily on week days.
Initial download of the metrics may take a while.