Fig. 9.
Download original image
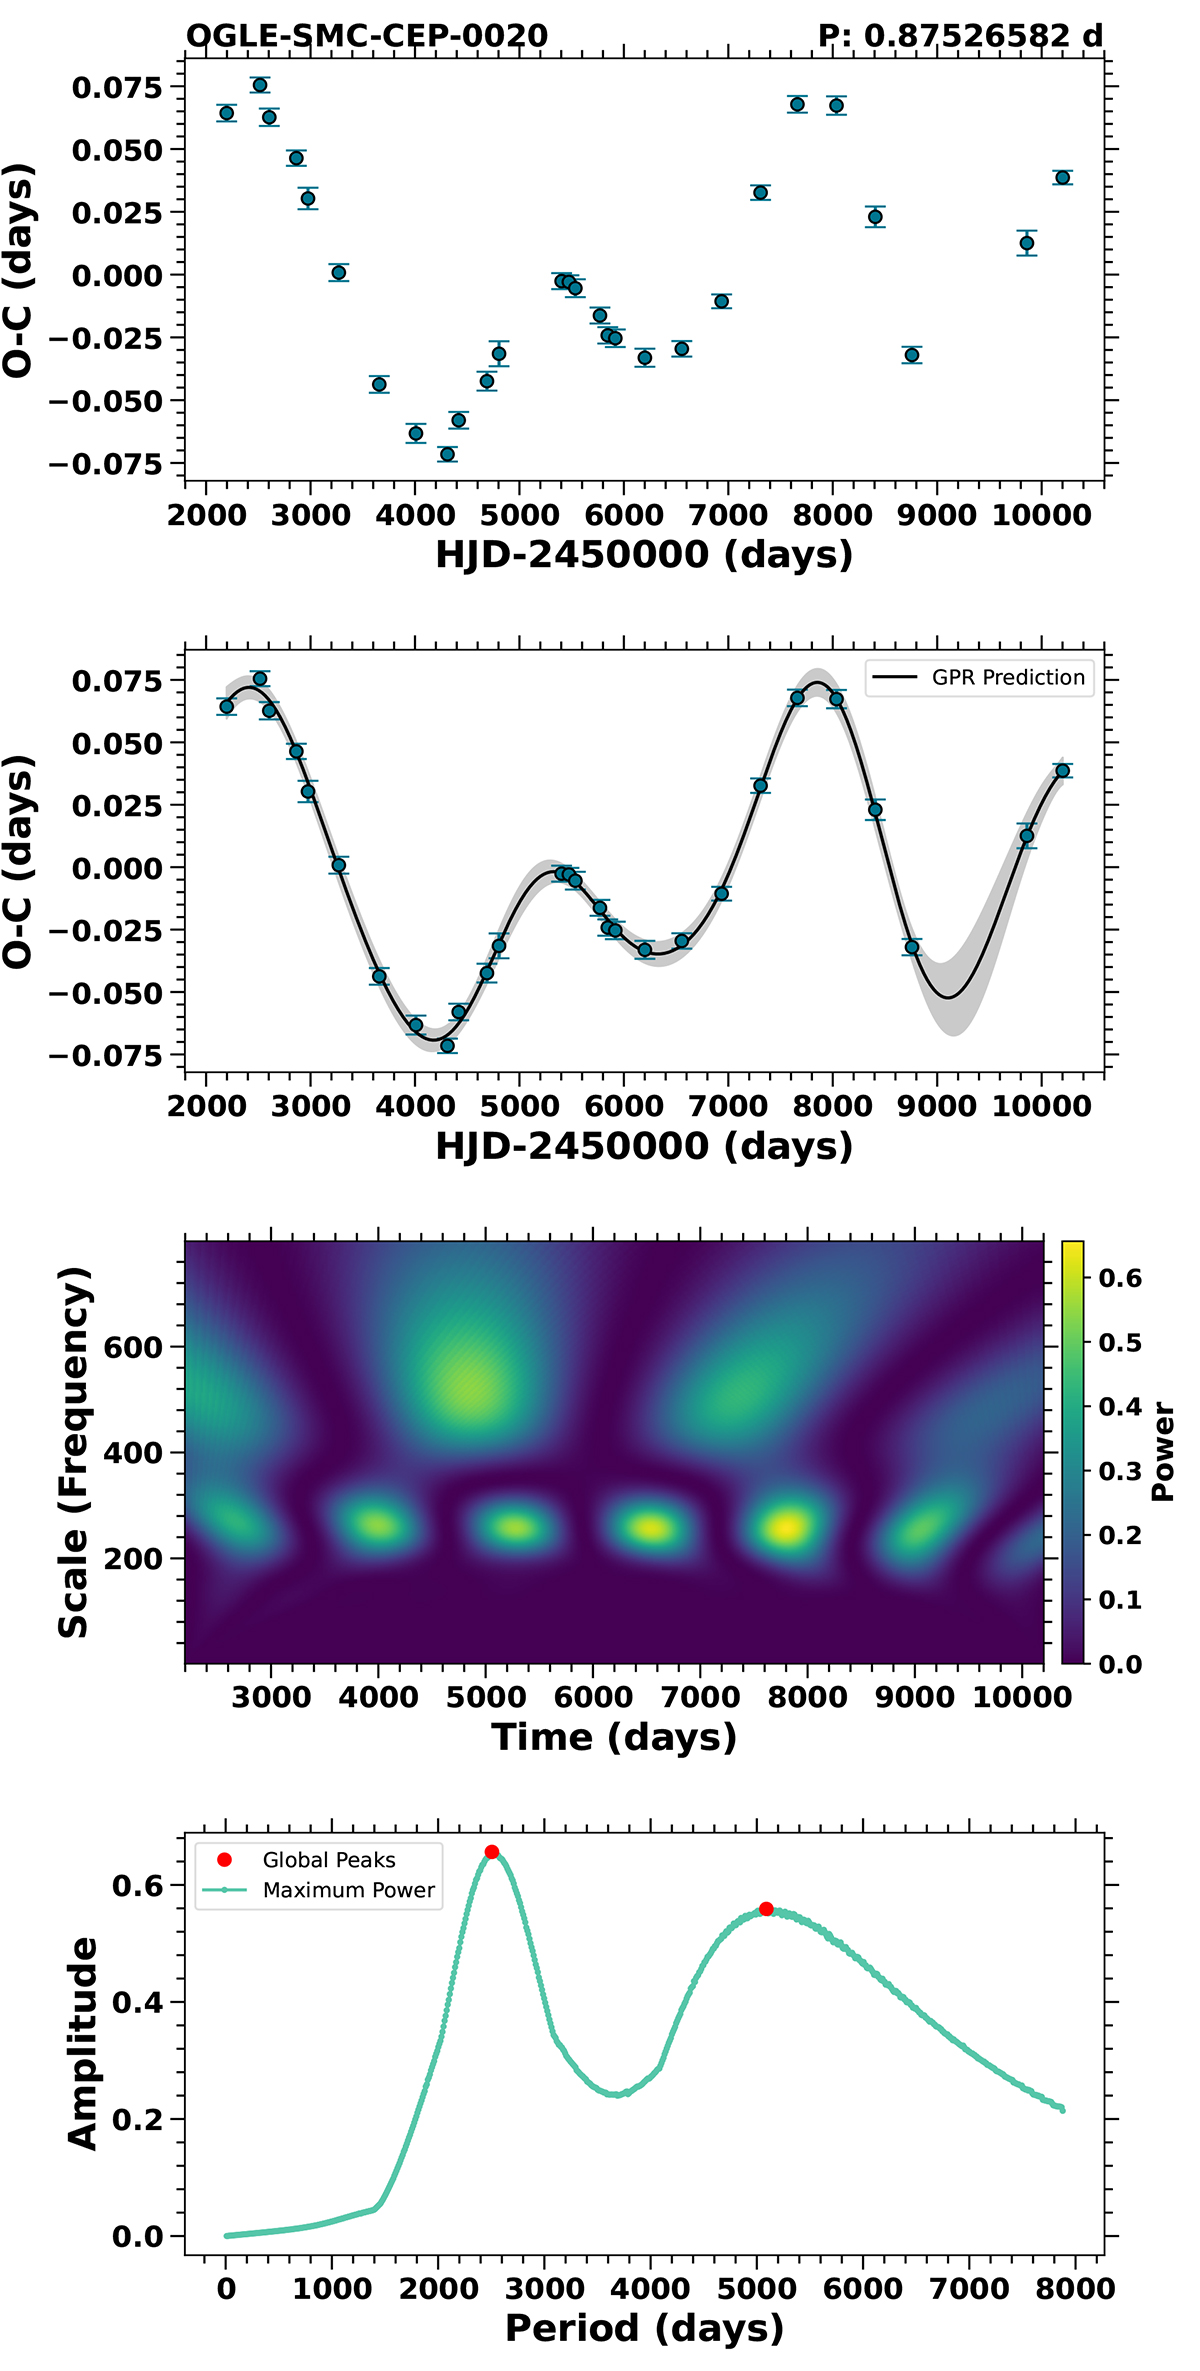
Wavelet analysis for OGLE-SMC-CEP-0020. The first panel shows the O − C diagram, while the second panel presents the O − C diagram with Gaussian Process Regression (GPR) applied (black), along with its uncertainty (gray). The third panel displays the wavelet transform of the smoothed GPR, with power represented by the colour bar. The fourth panel shows the maximum power (cyan) distribution, with global peaks highlighted in red. The highest peak determines the dominant variability timescale and amplitude.
Current usage metrics show cumulative count of Article Views (full-text article views including HTML views, PDF and ePub downloads, according to the available data) and Abstracts Views on Vision4Press platform.
Data correspond to usage on the plateform after 2015. The current usage metrics is available 48-96 hours after online publication and is updated daily on week days.
Initial download of the metrics may take a while.