Fig. 8.
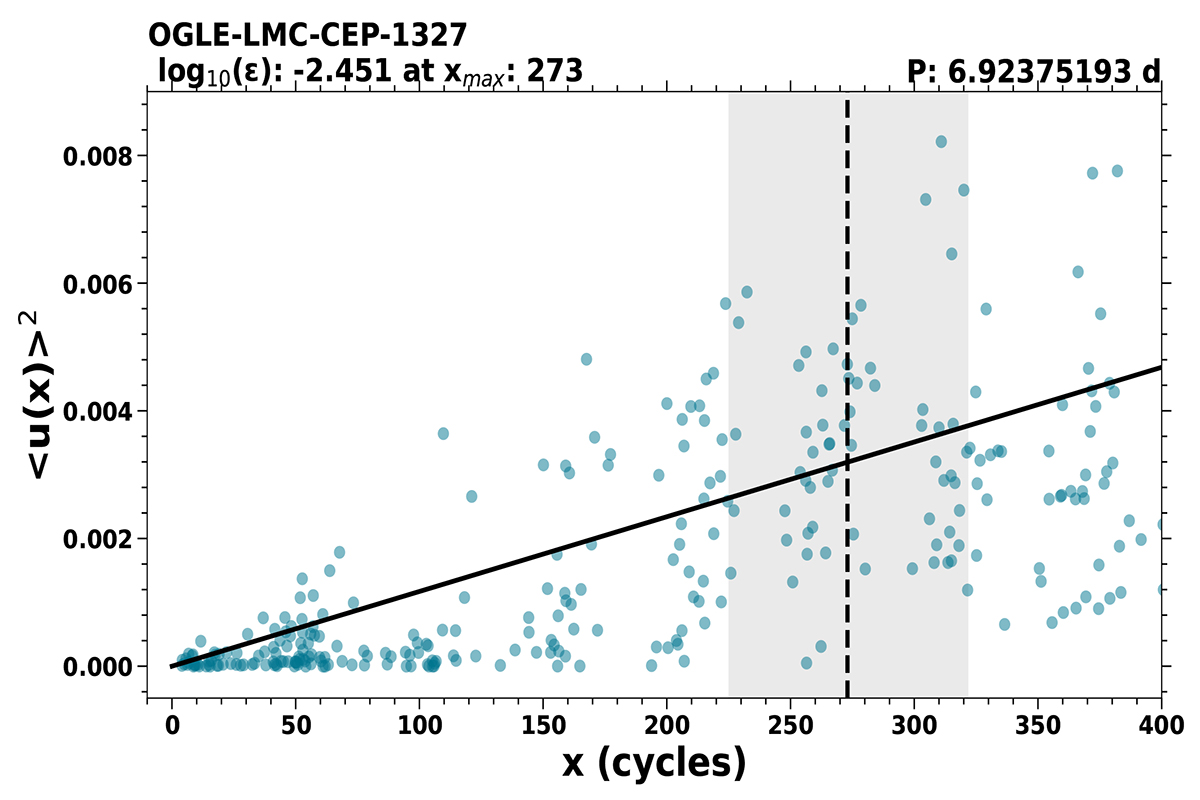
Download original image
Eddington-Plakidis test for OGLE-SMC-CEP-1530. The plot shows the distribution of the mean accumulated delays as a function of cycle separation. The black vertical line indicates the break point, with the uncertainty shaded in gray. The linear fit to the distribution terminates at this break point. The cycle separation at the break point, along with the fluctuation parameter calculated from the E–P test, is displayed on the top-left corner.
Current usage metrics show cumulative count of Article Views (full-text article views including HTML views, PDF and ePub downloads, according to the available data) and Abstracts Views on Vision4Press platform.
Data correspond to usage on the plateform after 2015. The current usage metrics is available 48-96 hours after online publication and is updated daily on week days.
Initial download of the metrics may take a while.