Open Access
Fig. 3.
Download original image
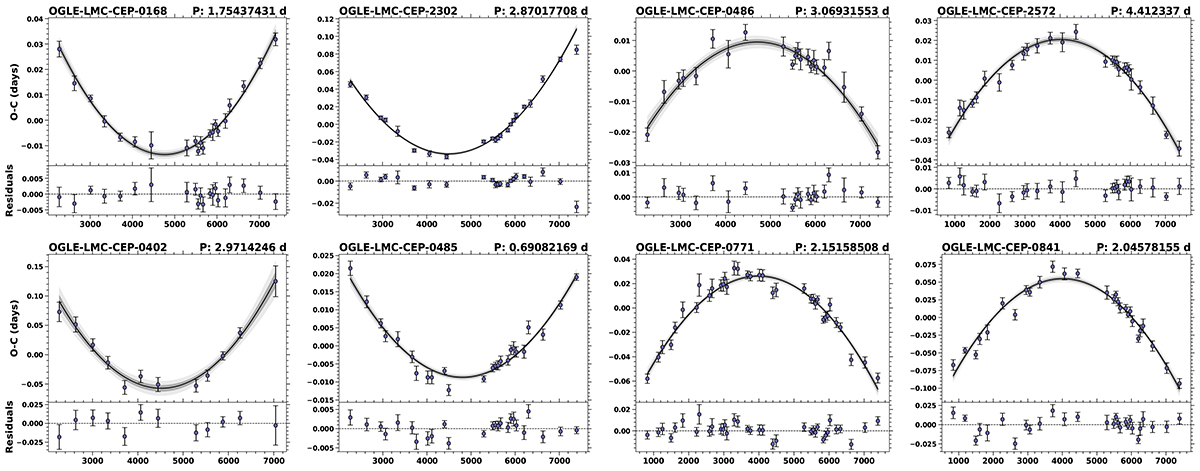
Examples of parabolic shape O − C diagrams (class 2) over-plotted with their MCMC linear fit solution (in gray) showing LMC F-mode (row 1) and LMC 1O-mode (row 2) candidates. Above each panel, the OGLE-ID and pulsation period are shown.
Current usage metrics show cumulative count of Article Views (full-text article views including HTML views, PDF and ePub downloads, according to the available data) and Abstracts Views on Vision4Press platform.
Data correspond to usage on the plateform after 2015. The current usage metrics is available 48-96 hours after online publication and is updated daily on week days.
Initial download of the metrics may take a while.