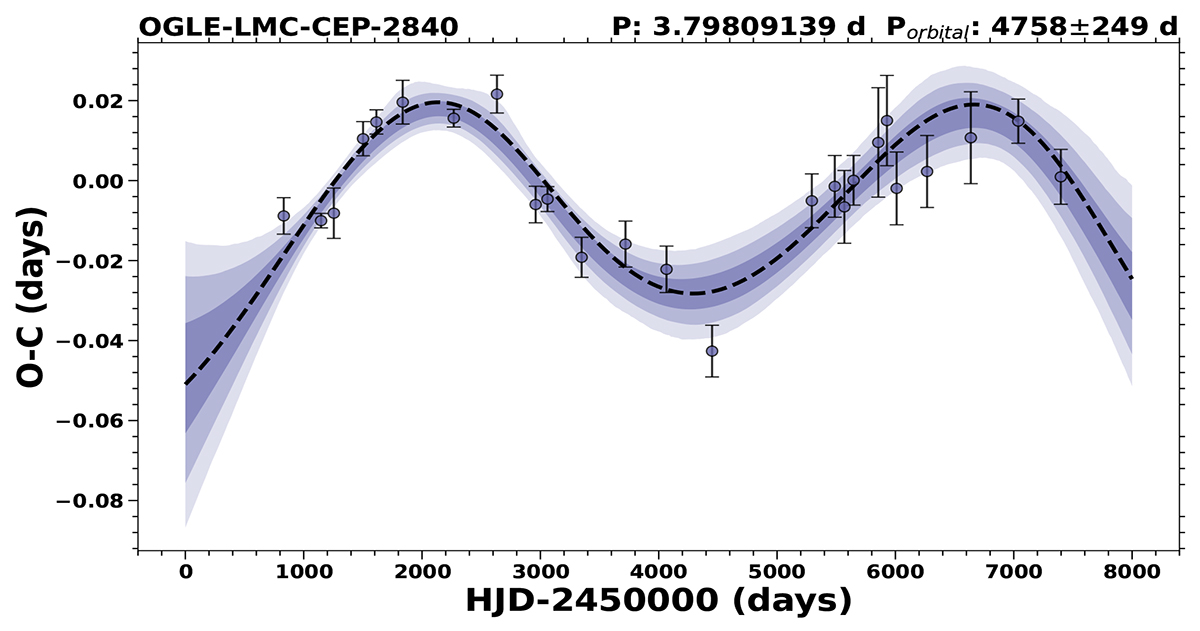
Fig. D.1.
Download original image
Binary model fit (following the method described in RSR 24) of the residual O-C diagram of OGLE-LMC-CEP-2840 (also see Fig. 11). The black dashed line represents the orbital solution obtained from the median parameter values of the posterior distribution. The blue-shaded regions contain the ranges (credible intervals) of individual MCMC solutions according to one, two, and three standard deviation at a given point in time, in order of decreasing transparency. Above the panel the OGLE-ID, adopted pulsation period to construct the O − C diagram and the orbital period are shown.
Current usage metrics show cumulative count of Article Views (full-text article views including HTML views, PDF and ePub downloads, according to the available data) and Abstracts Views on Vision4Press platform.
Data correspond to usage on the plateform after 2015. The current usage metrics is available 48-96 hours after online publication and is updated daily on week days.
Initial download of the metrics may take a while.