Open Access
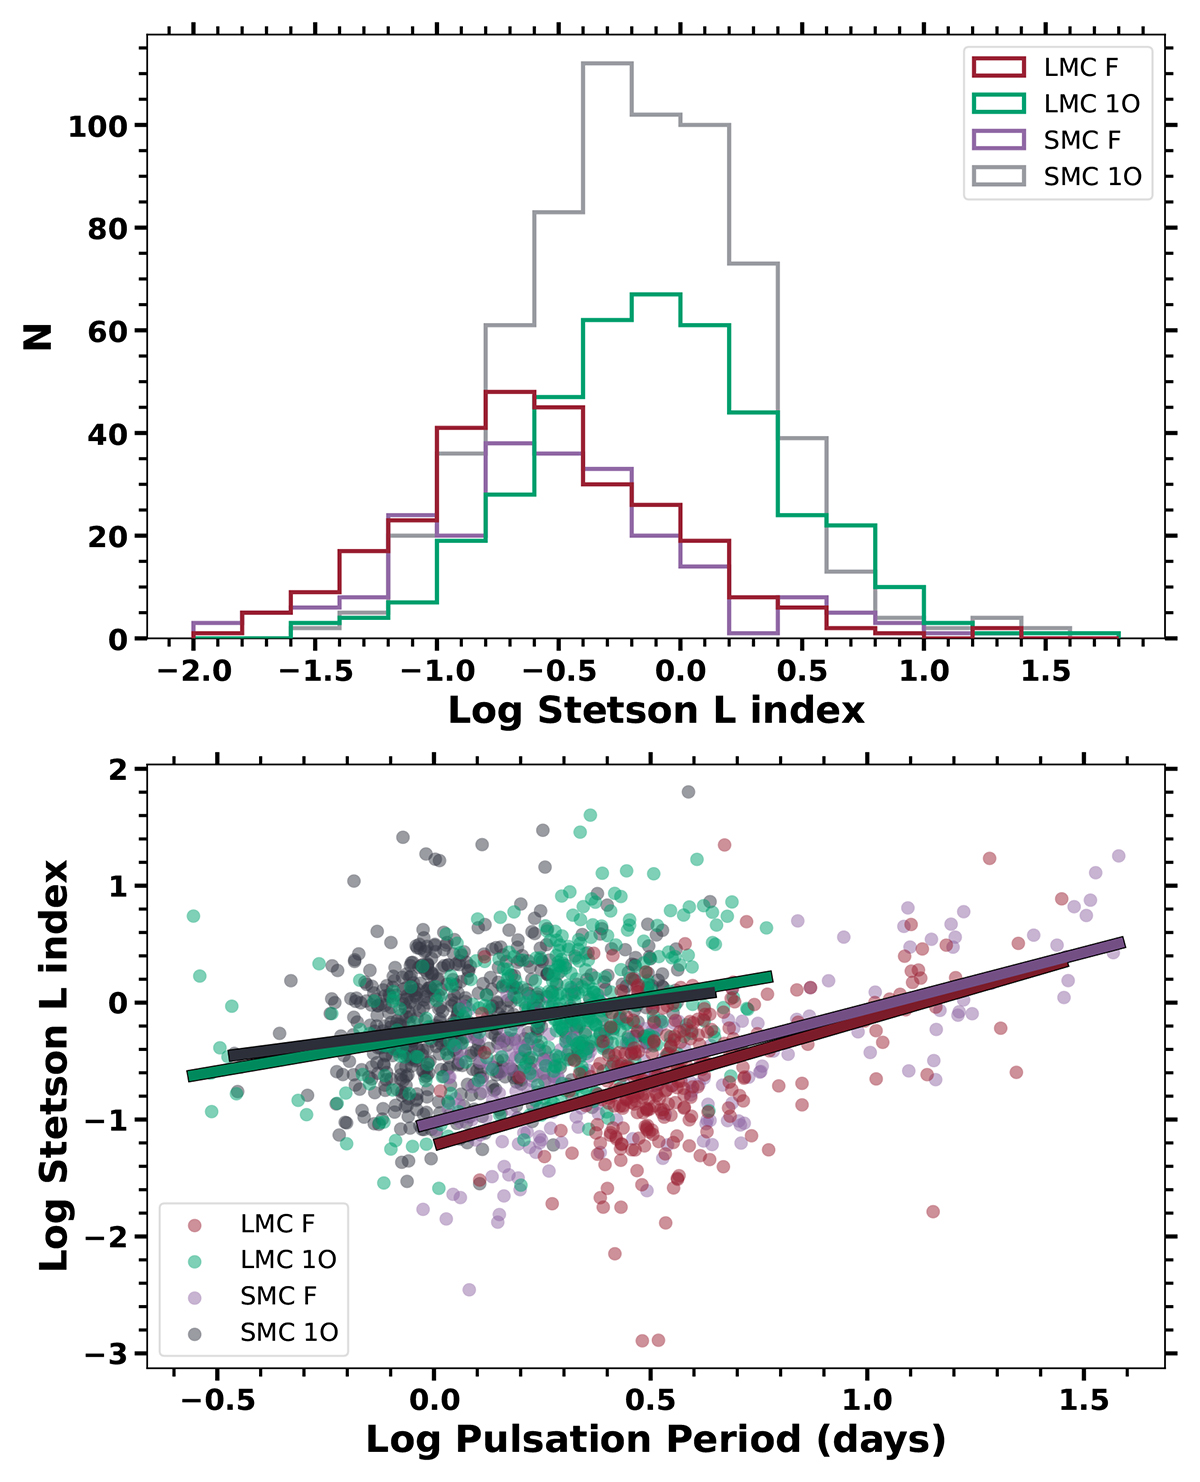
Fig. 18.
Download original image
Distribution of the log Stetson L index is shown in upper panel. The colour schemes are LMC F (red), LMC 1O (green), SMC F (purple) and SMC 1O (gray). The lower panel shows the log Stetson L index as a function of the log pulsation period. The scatter points have the same colour scheme as in the top panel.
Current usage metrics show cumulative count of Article Views (full-text article views including HTML views, PDF and ePub downloads, according to the available data) and Abstracts Views on Vision4Press platform.
Data correspond to usage on the plateform after 2015. The current usage metrics is available 48-96 hours after online publication and is updated daily on week days.
Initial download of the metrics may take a while.