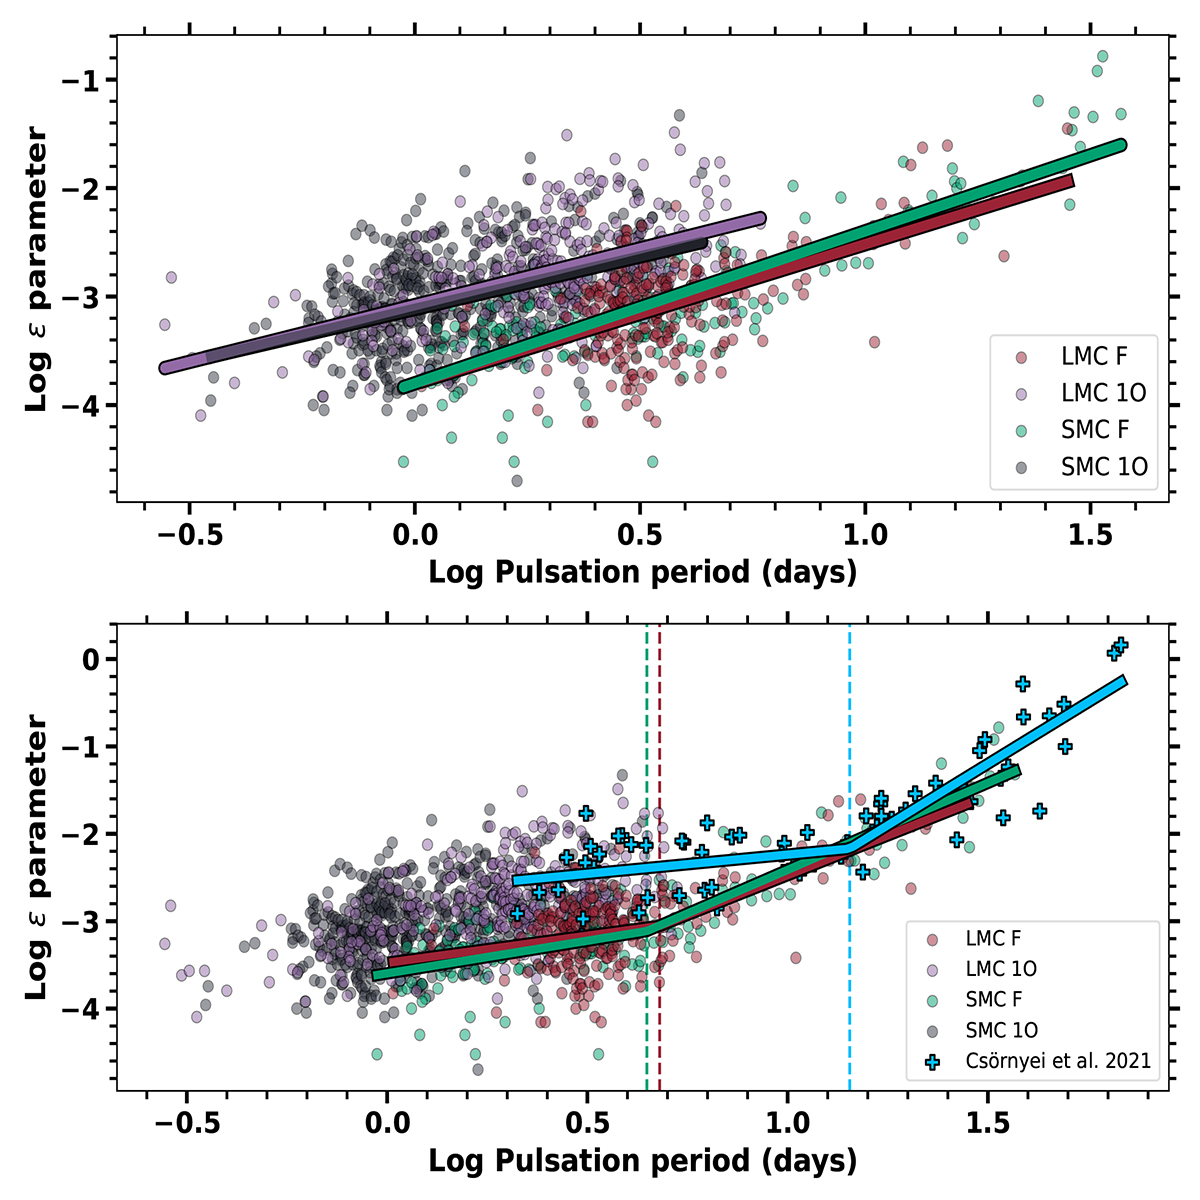
Fig. 14.
Download original image
Distribution of logarithm of fluctuation parameter (ϵ) as a function of log pulsation period shown in the upper panel. Scatter points represent LMC F (red), LMC 1O (green), SMC F (purple), and SMC 1O (gray) samples, with linear fits to each sample displayed in the corresponding colour. The lower panel includes the same sample, along with Galactic F-mode Cepheids from Csörnyei et al. (2022) (blue plus symbols). Broken linear regressions are shown for the Galactic, LMC, and SMC F-mode samples, respectively.
Current usage metrics show cumulative count of Article Views (full-text article views including HTML views, PDF and ePub downloads, according to the available data) and Abstracts Views on Vision4Press platform.
Data correspond to usage on the plateform after 2015. The current usage metrics is available 48-96 hours after online publication and is updated daily on week days.
Initial download of the metrics may take a while.