Fig. 13.
Download original image
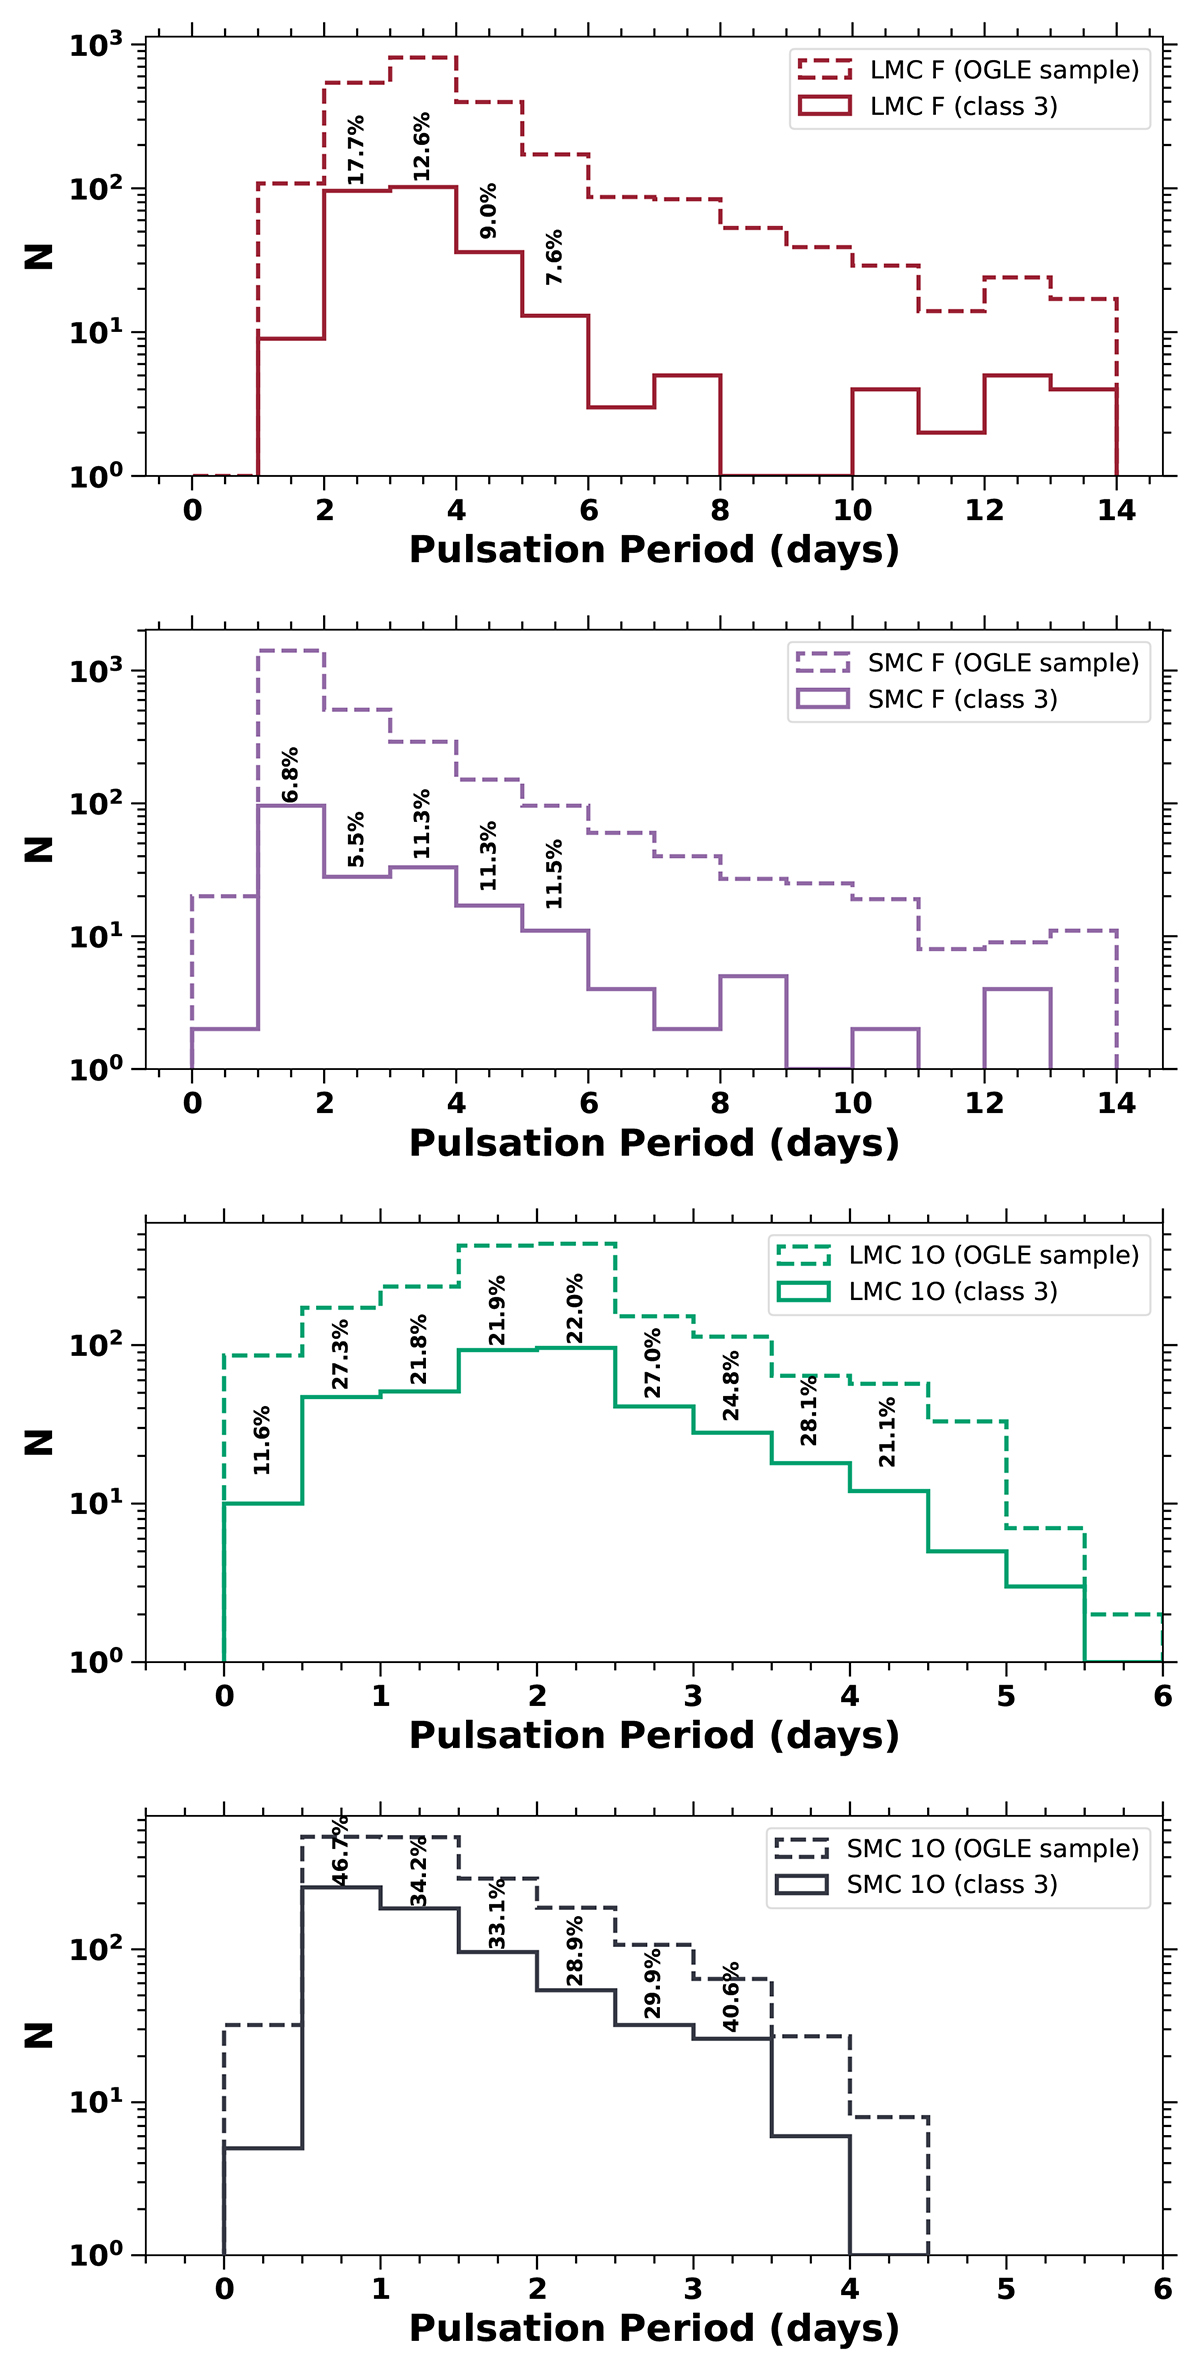
Pulsation period distribution for the parent OGLE sample (dashed lines) and irregular period change candidates (class 3, solid lines). From top to bottom, the panels show the distributions for LMC F, SMC F, LMC 1O, and SMC 1O mode Cepheids, respectively. The incidence rate for irregular period change candidates is displayed for bins containing at least 10 Cepheids and with an incidence rate exceeding 5%.
Current usage metrics show cumulative count of Article Views (full-text article views including HTML views, PDF and ePub downloads, according to the available data) and Abstracts Views on Vision4Press platform.
Data correspond to usage on the plateform after 2015. The current usage metrics is available 48-96 hours after online publication and is updated daily on week days.
Initial download of the metrics may take a while.