Fig. 12.
Download original image
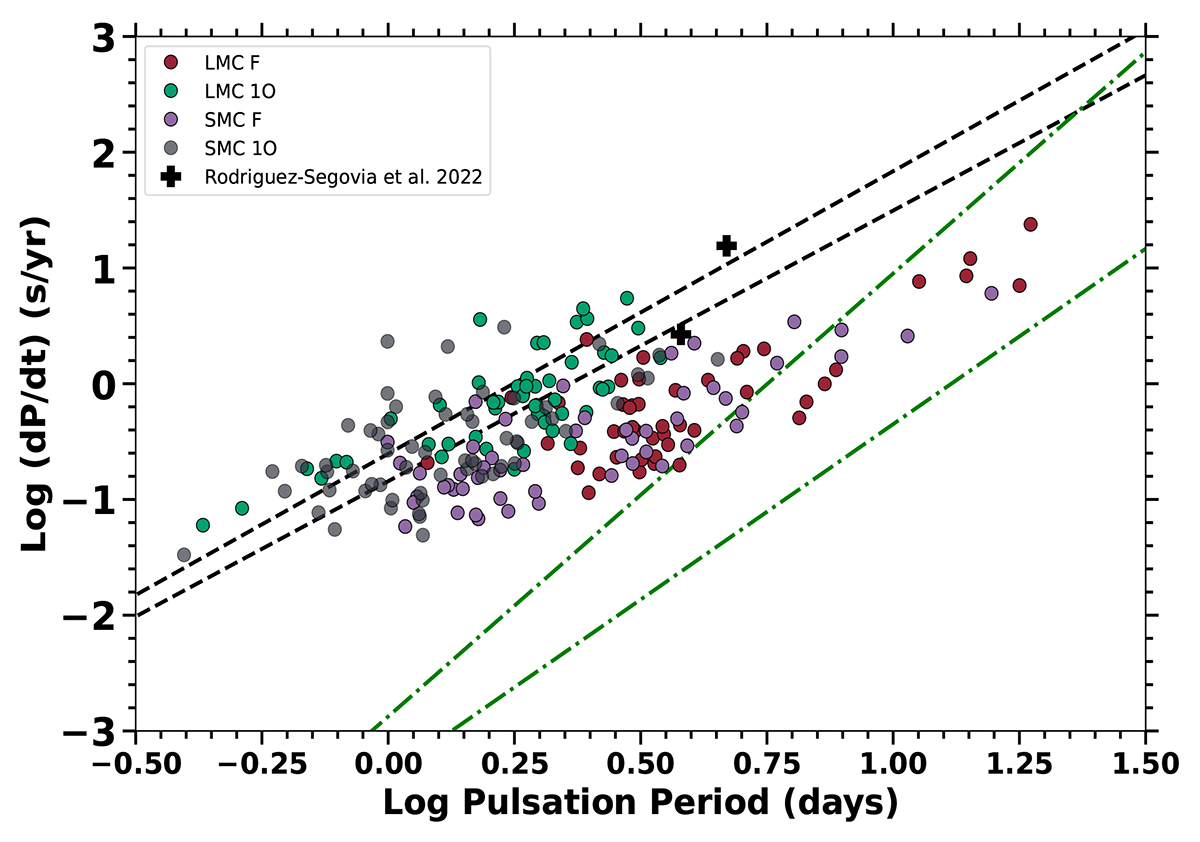
Distribution of log period change rate for first crossing candidates in class 2 sample as a function of log pulsation period. The scatter points represent different samples: LMC F (red), LMC 1O (green), SMC F (purple), and SMC 1O (gray). The theoretical regions for the first and third crossings, as described by Turner et al. (2006), are indicated by black dashed and green dot-dashed lines, respectively. Two black plus symbols represent the first crossing candidates identified by Rodríguez-Segovia et al. (2022).
Current usage metrics show cumulative count of Article Views (full-text article views including HTML views, PDF and ePub downloads, according to the available data) and Abstracts Views on Vision4Press platform.
Data correspond to usage on the plateform after 2015. The current usage metrics is available 48-96 hours after online publication and is updated daily on week days.
Initial download of the metrics may take a while.