Fig. 10.
Download original image
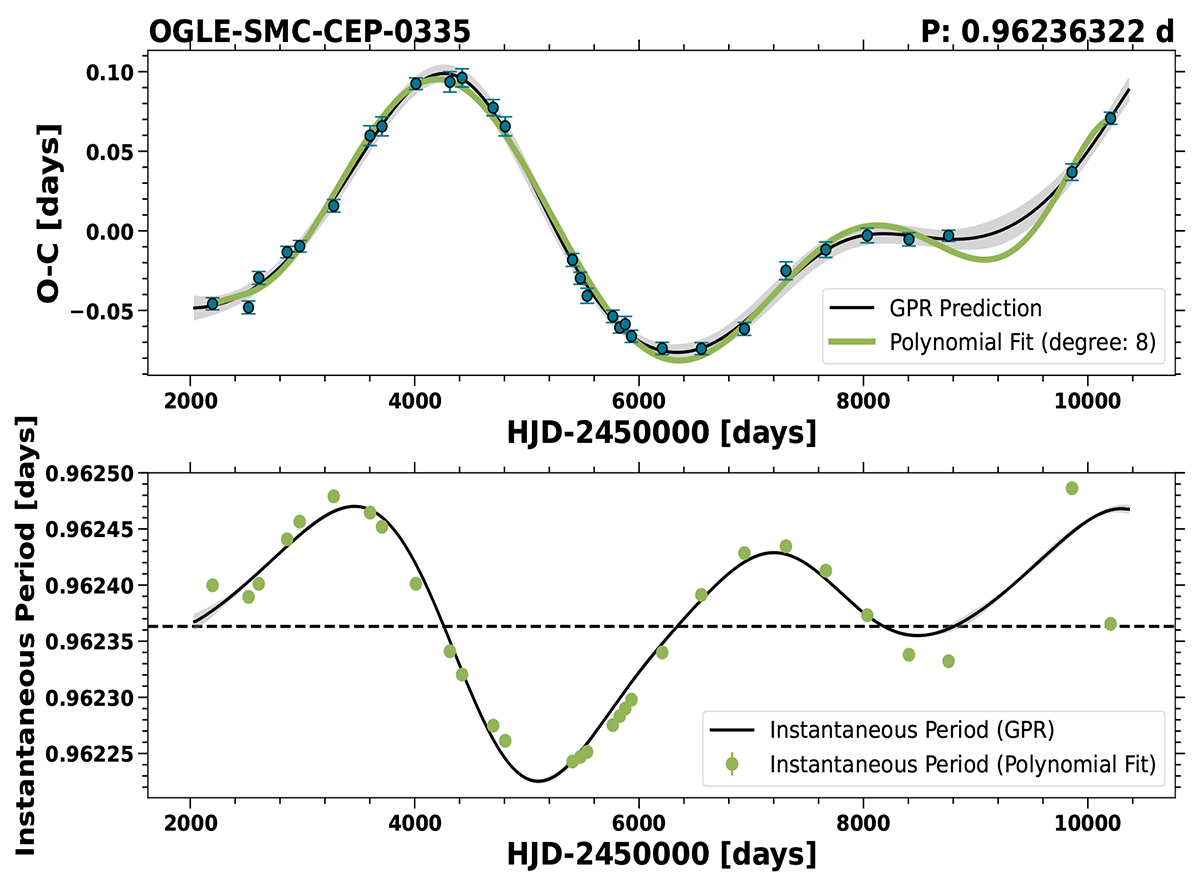
Calculation of the instantaneous period for OGLE-SMC-CEP-0335. The upper panel displays the O − C diagram with the GPR prediction (black) and its uncertainty (gray), along with a polynomial fit (green). The lower panel presents the instantaneous periods derived from the fits in the upper panel. The horizontal dashed black line indicates the mean pulsation period of the Cepheid.
Current usage metrics show cumulative count of Article Views (full-text article views including HTML views, PDF and ePub downloads, according to the available data) and Abstracts Views on Vision4Press platform.
Data correspond to usage on the plateform after 2015. The current usage metrics is available 48-96 hours after online publication and is updated daily on week days.
Initial download of the metrics may take a while.