Fig. 8
Download original image
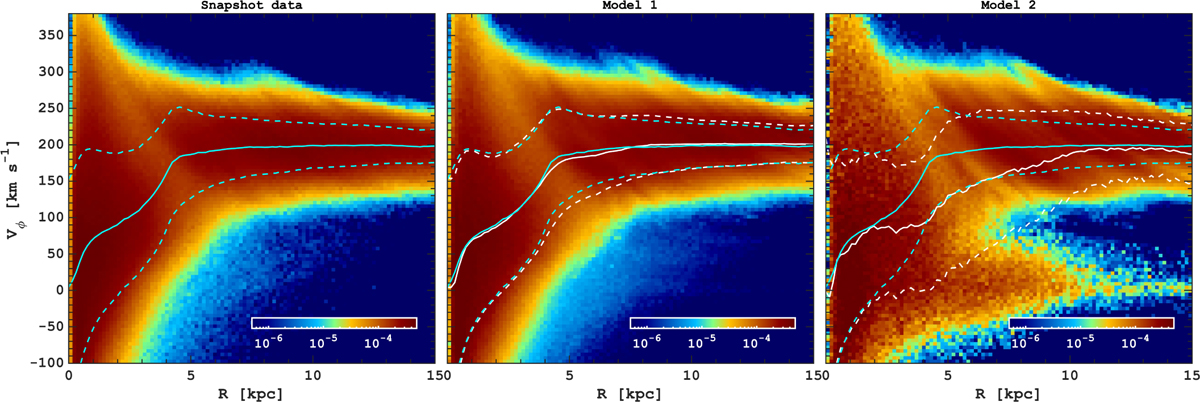
Reconstruction of the rotational velocity distribution as a function of the galactocentric distance. The left panel displays the stellar density distribution (normalized by the total stellar mass) in the simulation, while the middle and right panels depict the stellar density reconstructed using orbit superposition based on Mock 1 and Mock 2, respectively. In all panels, the cyan lines represent the mean (solid) and mean ± standard deviation (dashed) of the snapshot data. Correspondingly, the white lines denote the same quantities derived from the orbit superposition. As evident from the middle panes, Model 1 is able to recover not only the mean rotational velocity but also the velocity dispersion as a function of galactocentric distance, including some small details associated with the presence of the bar.
Current usage metrics show cumulative count of Article Views (full-text article views including HTML views, PDF and ePub downloads, according to the available data) and Abstracts Views on Vision4Press platform.
Data correspond to usage on the plateform after 2015. The current usage metrics is available 48-96 hours after online publication and is updated daily on week days.
Initial download of the metrics may take a while.