Fig. 7
Download original image
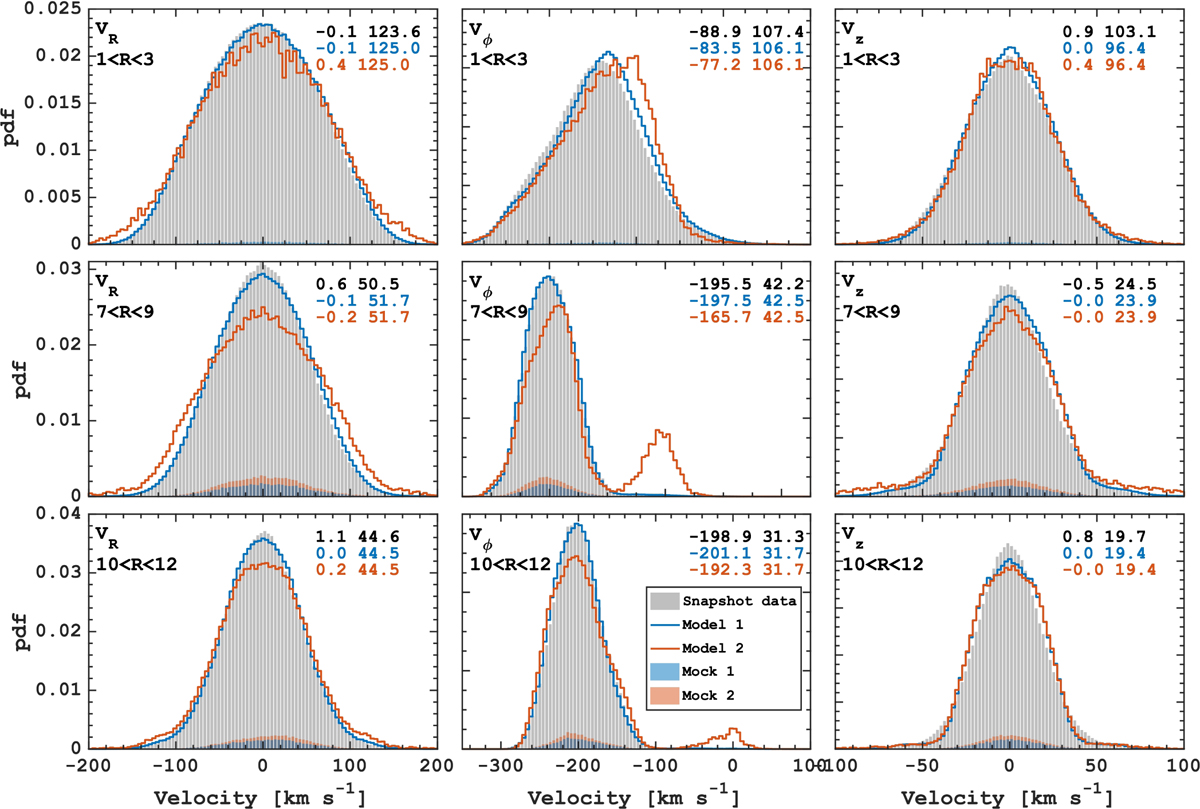
Distribution of velocity components (VR in left, Vϕ in the middle, and Vz in the right) in the galactic rest frame within three 2 kpc-wide annuli centred at 1 (top), 8 (middle), and 11 kpc (bottom). The snapshot data are represented by the grey-filled areas, while the results of the orbit superposition based on Mock 1 and Mock 2 are depicted in blue and red colours, respectively. The blue and red-filled areas correspond to the initial mock data. For each panel, the numbers correspond to the mean and standard deviation of the velocity distribution in km s−1. We emphasise that the orbit superposition method we employ aims to recover the approximated stellar density distribution; the figure shows that Model 1 reproduces the kinematic information very well. At the same time, this approach is unable to capture spiral arms or the non-equilibrium kinematic features of the disc and bar. Furthermore, the effectiveness of the orbit superposition technique is contingent upon the accuracy of the potential approximation.
Current usage metrics show cumulative count of Article Views (full-text article views including HTML views, PDF and ePub downloads, according to the available data) and Abstracts Views on Vision4Press platform.
Data correspond to usage on the plateform after 2015. The current usage metrics is available 48-96 hours after online publication and is updated daily on week days.
Initial download of the metrics may take a while.