Fig. 5
Download original image
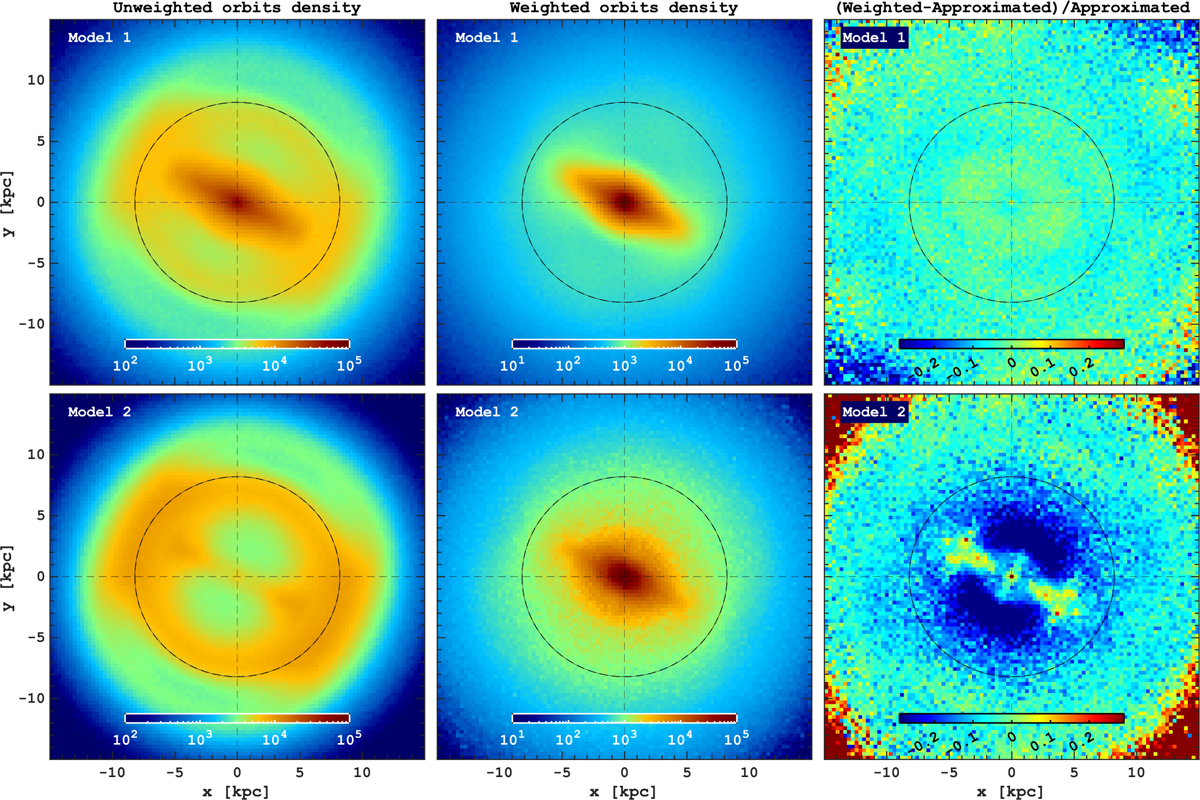
Results of the orbit superposition method. The left panels display the stellar density of orbits with constant weights, essentially presenting the stacked library of orbits of all star particles from Mock 1 (top) and Mock 2 (bottom). The middle panels depict the stellar density reconstructed using weighted orbit superposition where the weights are calculated as the mean across ten orbit superposition realizations (see details in Sect. 3.1). The rightmost panels illustrate the relative residuals between the orbit superposition reconstruction and gravitational potential-based approximation (see Fig. 2 and Sect. 2.2 for more details).
Current usage metrics show cumulative count of Article Views (full-text article views including HTML views, PDF and ePub downloads, according to the available data) and Abstracts Views on Vision4Press platform.
Data correspond to usage on the plateform after 2015. The current usage metrics is available 48-96 hours after online publication and is updated daily on week days.
Initial download of the metrics may take a while.