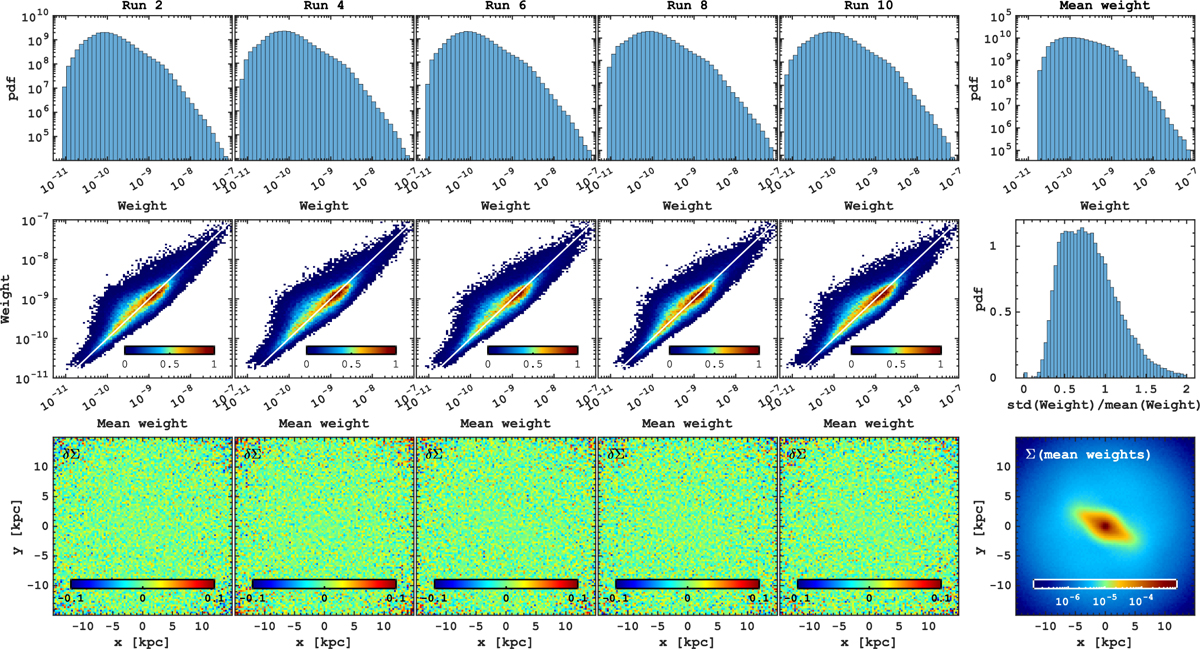
Fig. 4
Download original image
Analysis of weights of orbits across various orbit superposition model realizations using Mock 1. The five left panels of the top row illustrate the weight distribution in five realizations of the orbit superposition using different 10% randomly sampled orbits, while the rightmost column shows the distribution of mean weights averaged across these realizations. In the second row, the five left panels reveal the relationship between mean weights and those obtained in different realizations of orbit superposition. The rightmost panel in this row presents the ratio between the standard deviation of weights and their mean. The bottom panels depict the relative difference between the stellar surface density obtained in various realizations and the surface density obtained using the mean orbital weights. Although a certain level of stochasticity in the distribution of the weights is seen, all the realizations successfully recover the same density distribution, which is nearly identical to the density based on the mean weights. The observed discrepancy in the orbital weight distribution across different realizations is likely attributed to a non-orthogonal orbital library. We, therefore, recommend using weights averaged across several orbit superposition realizations for more stable results.
Current usage metrics show cumulative count of Article Views (full-text article views including HTML views, PDF and ePub downloads, according to the available data) and Abstracts Views on Vision4Press platform.
Data correspond to usage on the plateform after 2015. The current usage metrics is available 48-96 hours after online publication and is updated daily on week days.
Initial download of the metrics may take a while.