Fig. 2
Download original image
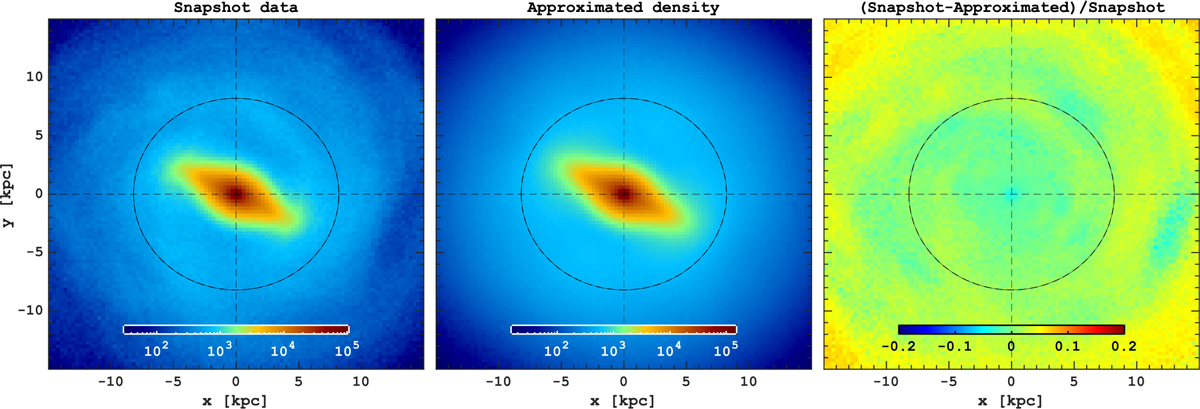
Approximation of the stellar disc density from the simulation. The surface density of star particles in a snapshot is shown in the left panel. In the middle panel, we present the surface density of the stellar disk obtained from the potential approximated using multipole expansion (see Section 2.2 for details). The rightmost panel shows the difference between the two maps, divided by the snapshot stellar density. Notably, the approximated density (and potential) reproduces well the large-scale structure of the simulated galaxy, including the bar 3D structure; however, by construction, small-scale asymmetries such as spiral arms are not captured. The black circle shows the solar radius of 8.2 kpc. The bar orientation is chosen to be 27∘ relative to the horizontal axis, reproducing the MW bar positioning.
Current usage metrics show cumulative count of Article Views (full-text article views including HTML views, PDF and ePub downloads, according to the available data) and Abstracts Views on Vision4Press platform.
Data correspond to usage on the plateform after 2015. The current usage metrics is available 48-96 hours after online publication and is updated daily on week days.
Initial download of the metrics may take a while.