Fig. 12
Download original image
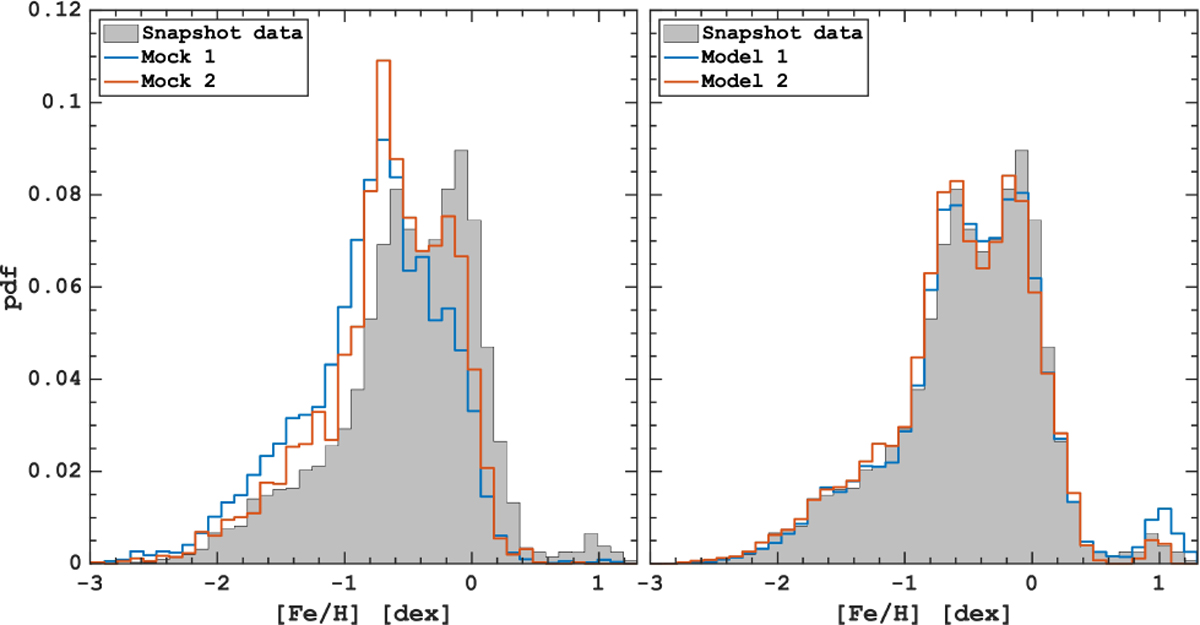
Left panel: [Fe/H] distribution for stars in the initial model selections (blue and red). Right panel: results of the orbital decomposition. In both panels, the MDF of stars in the simulation snapshot is represented by the grey-filled histogram. The MDFs of the initial selections are biased against relatively metal-rich stars, which is corrected by the orbit superposition modelling. We emphasise that our approach enables the recovery of the complex shape of the MDF, characterized by multiple peaks, including a small fraction of extremely metal-rich stars originating from the centre of the simulated galaxy. This underscores the capability of our method to reconstruct any characteristics (abundances and ages) of stellar populations that are evolutionarily linked to the orbital parameters of stars.
Current usage metrics show cumulative count of Article Views (full-text article views including HTML views, PDF and ePub downloads, according to the available data) and Abstracts Views on Vision4Press platform.
Data correspond to usage on the plateform after 2015. The current usage metrics is available 48-96 hours after online publication and is updated daily on week days.
Initial download of the metrics may take a while.