Fig. 10
Download original image
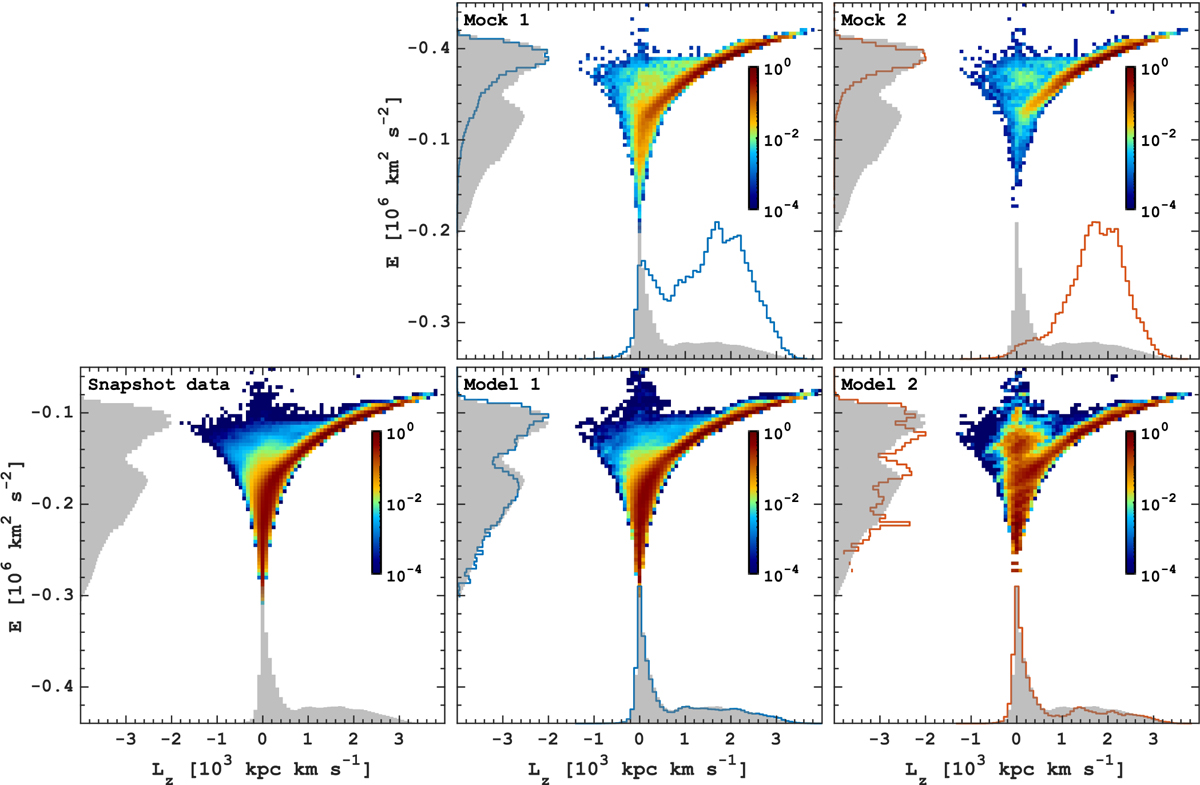
Reconstruction of energy-angular momentum space. The top row displays the initial distribution of stars from the simulation in the E – Lz space in two APOGEE-like mock spatial selections adopted for analysis. The bottom row presents a comparison between the snapshot data (left) and the results of the orbit superposition based on Mock 1 (middle) and Mock 2 (right). Across all panels, the grey-filled area represents the generalised distributions of E and Lz in the snapshot data, contrasted with Mock 1 (blue) and Mock 2 (red) in the middle, the results of the models are at the bottom. The density distribution maps are normalized by the maximum value in a given panel. Both initial mocks are biased towards rotationally supported disc components, as evidenced by their density distributions peaking around the solar radius (see Fig. 3), thereby diminishing contributions from the innermost galaxy. However, the superposition models in the bottom row effectively correct such selection function biases, accurately reproducing the snapshot data.
Current usage metrics show cumulative count of Article Views (full-text article views including HTML views, PDF and ePub downloads, according to the available data) and Abstracts Views on Vision4Press platform.
Data correspond to usage on the plateform after 2015. The current usage metrics is available 48-96 hours after online publication and is updated daily on week days.
Initial download of the metrics may take a while.