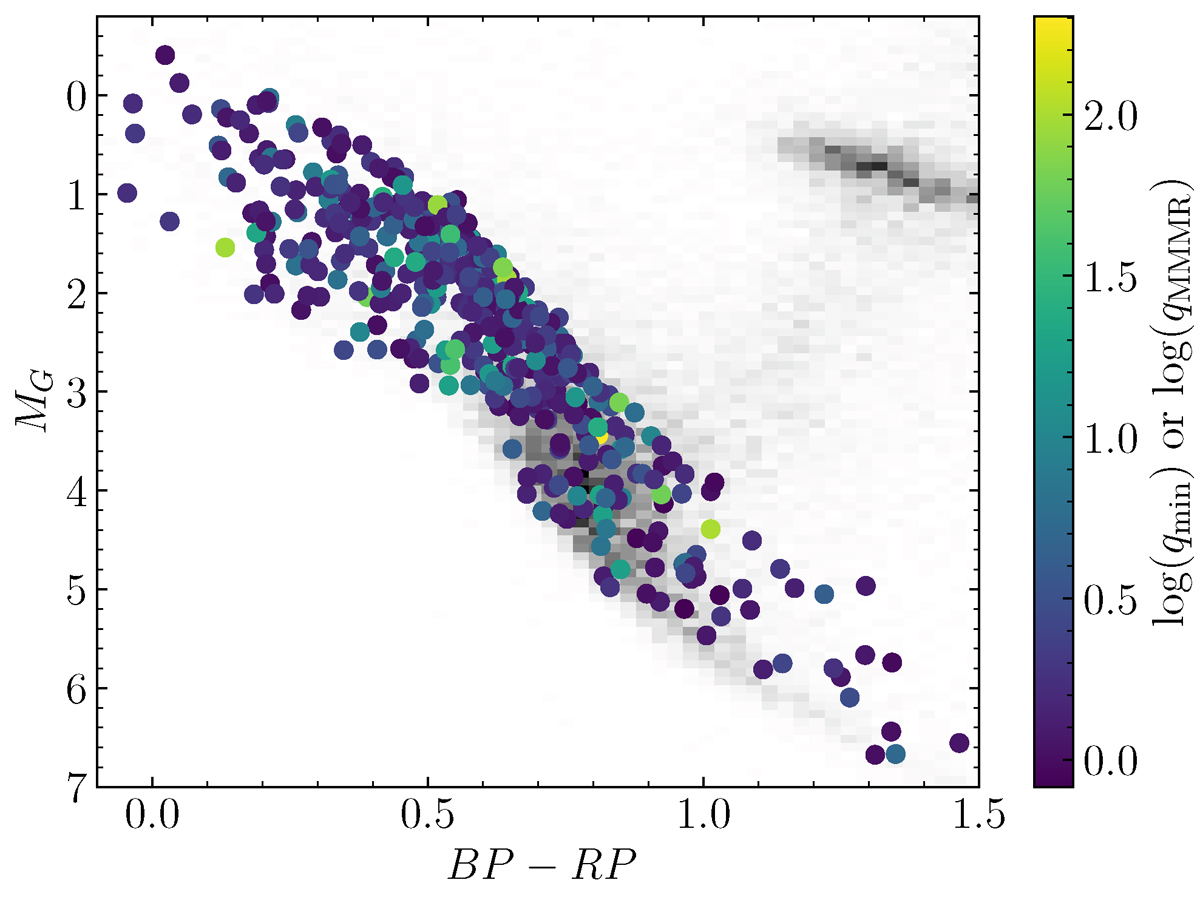
Fig. 5.
Download original image
Colour-magnitude diagram of our targets (coloured circles) compared to a magnitude-limited sample of stars (grey two-dimensional histogram). Our targets are coloured according to their ellipsoidal-implied qmin for targets with Porb > 1 day (Section 2.2), or by MMMR for targets with Porb < 1 day (Section 2.3). Many targets are somewhat elevated above the main sequence, but it is unclear whether this is due to light from the secondary star or due to inflation of the primary radius (we note that the latter is selected for by the ellipsoidal selection method).
Current usage metrics show cumulative count of Article Views (full-text article views including HTML views, PDF and ePub downloads, according to the available data) and Abstracts Views on Vision4Press platform.
Data correspond to usage on the plateform after 2015. The current usage metrics is available 48-96 hours after online publication and is updated daily on week days.
Initial download of the metrics may take a while.