Fig. 4.
Download original image
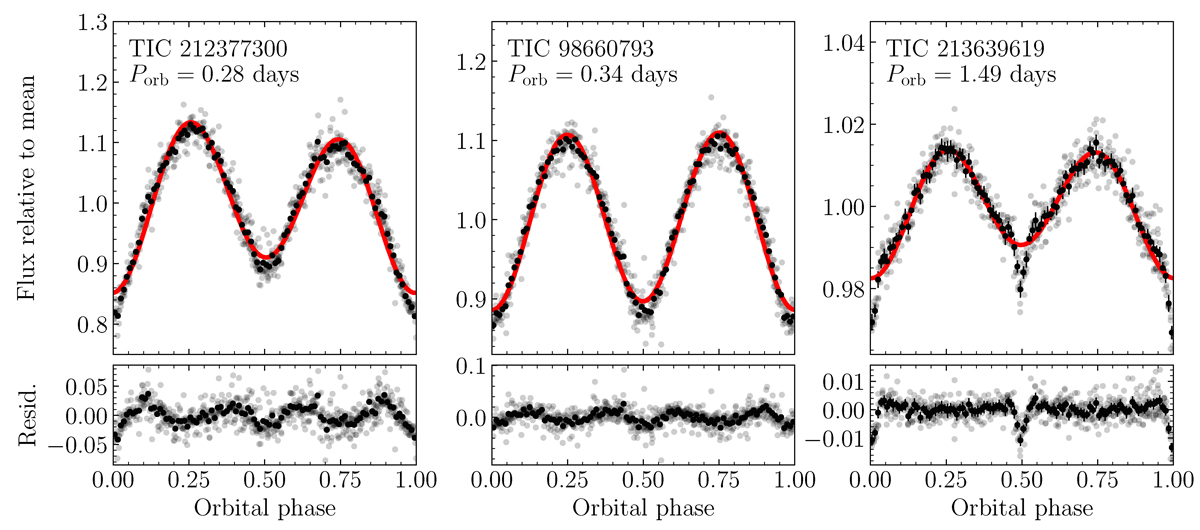
Several example light curves that were identified as showing eclipses. Grey points show the individual TESS data, black points are phase-binned data, and the red line shows the best-fit ellipsoidal model. Eclipse features may be shallow, but can be identified as a departure from the ellipsoidal model at orbital phases 0 and 0.5.
Current usage metrics show cumulative count of Article Views (full-text article views including HTML views, PDF and ePub downloads, according to the available data) and Abstracts Views on Vision4Press platform.
Data correspond to usage on the plateform after 2015. The current usage metrics is available 48-96 hours after online publication and is updated daily on week days.
Initial download of the metrics may take a while.