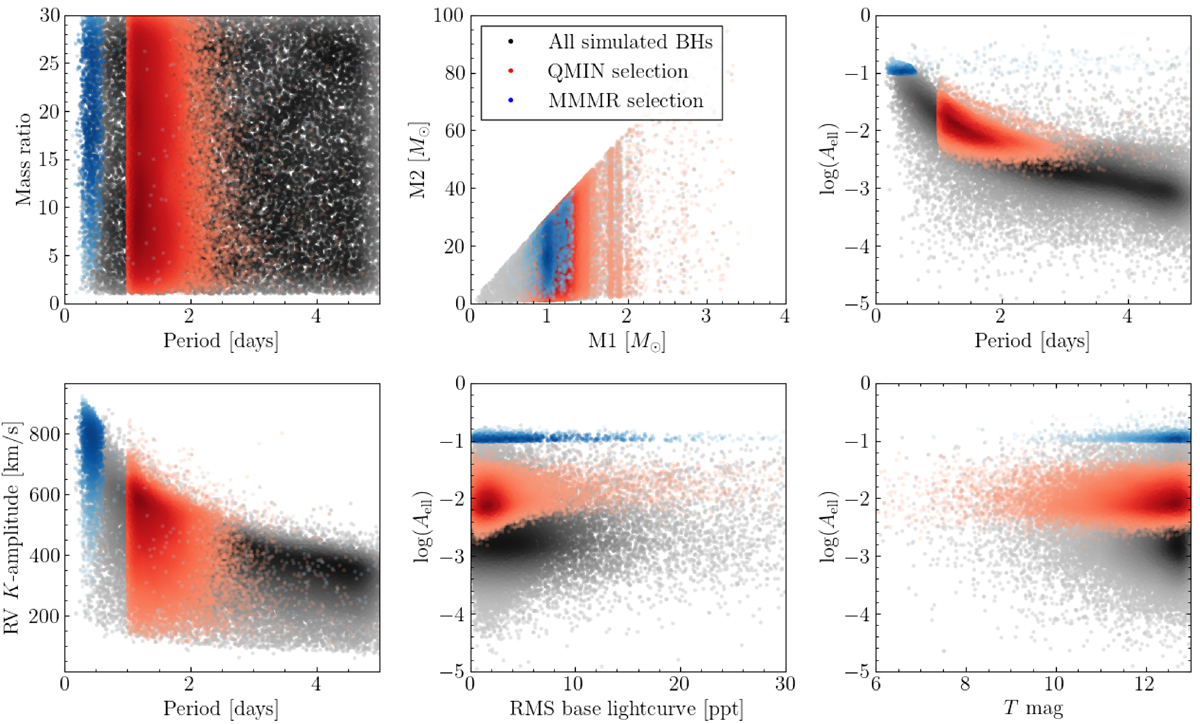
Fig. 12.
Download original image
Properties of the simulated BH-LC population, with coloured highlights showing the subsets of systems that were selected using the mmmr and qmin methods. The panels show the input distributions of Porb, q, M1 and M2, the distributions of the measured properties Aell and K, and the behaviour of Aell as a function of T-band apparent magnitude and the RMS of the base light curve. The latter property includes shot noise which depends on SNR (and hence is related to T-band magnitude), but also includes additional scatter due to TESS instrument systematics or intrinsic stellar variability.
Current usage metrics show cumulative count of Article Views (full-text article views including HTML views, PDF and ePub downloads, according to the available data) and Abstracts Views on Vision4Press platform.
Data correspond to usage on the plateform after 2015. The current usage metrics is available 48-96 hours after online publication and is updated daily on week days.
Initial download of the metrics may take a while.