Fig. 10.
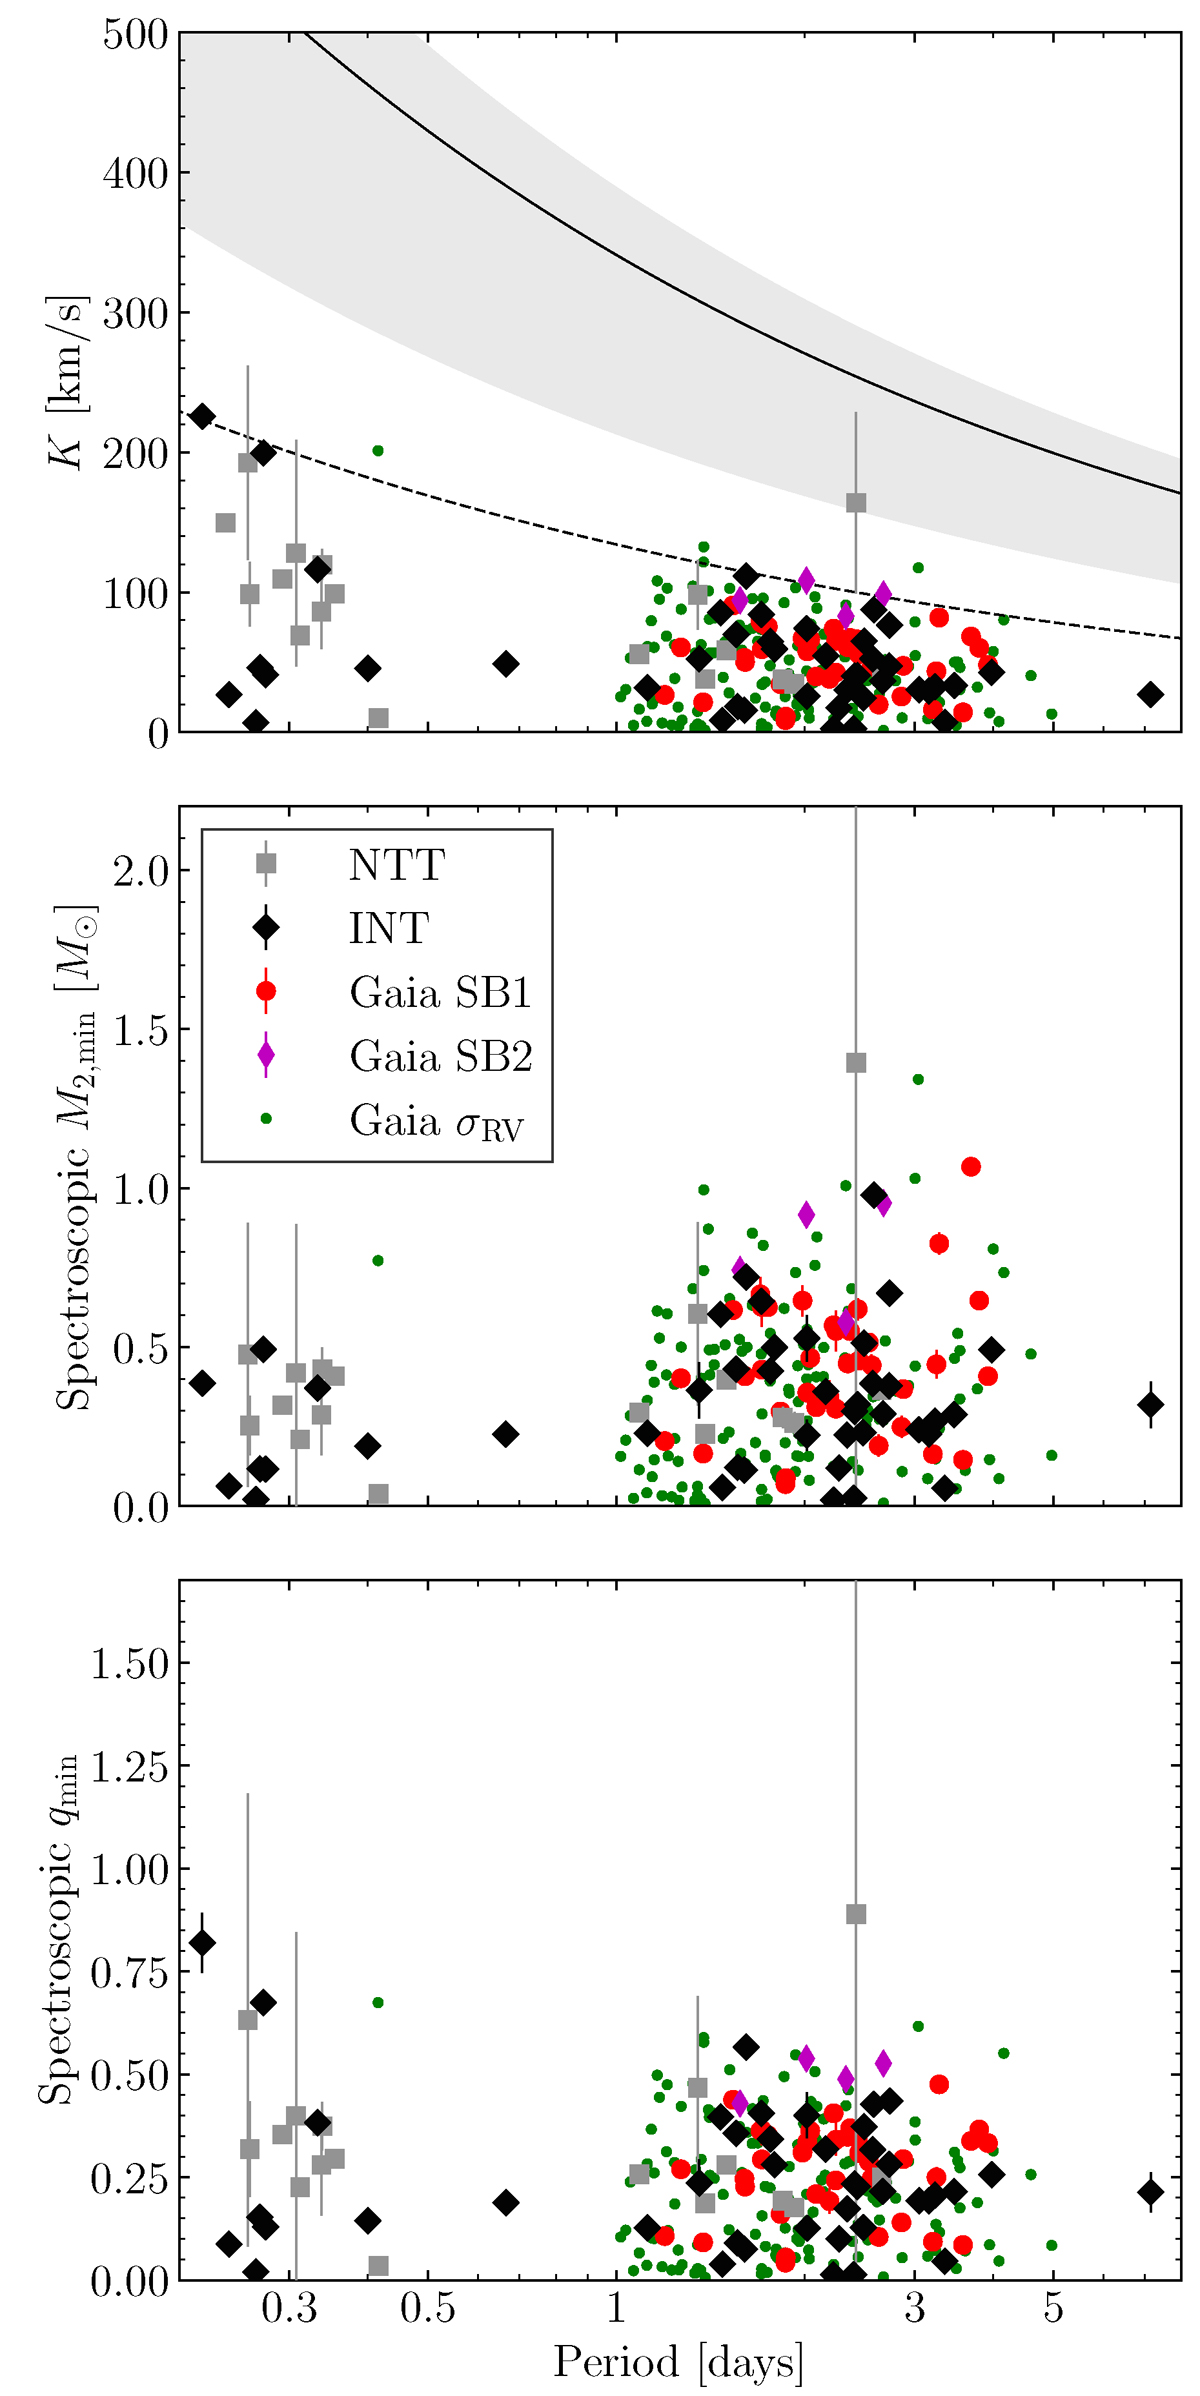
Download original image
Measured K-amplitudes (top) and the implied lower limits on M2 (middle) and q (bottom) for our observed targets. Also plotted in the top panel are the expected K-amplitudes for a 1 M⊙ star with an 8 M⊙ companion at the median orbital inclination (solid black line) and the central 64 percent range (shaded region) for a geometric distribution of inclinations; and the maximum expected amplitude for an equal-mass binary (dashed line). The deficiency of targets in the period range 0.5–1 days is due to the different selection methods applied at shorter and longer periods, as is described in the text. None of the systems followed up has spectroscopic M2, min > 3 M⊙ or qmin > 1, and in most cases a typical-mass black hole can be ruled out at the 2σ level.
Current usage metrics show cumulative count of Article Views (full-text article views including HTML views, PDF and ePub downloads, according to the available data) and Abstracts Views on Vision4Press platform.
Data correspond to usage on the plateform after 2015. The current usage metrics is available 48-96 hours after online publication and is updated daily on week days.
Initial download of the metrics may take a while.