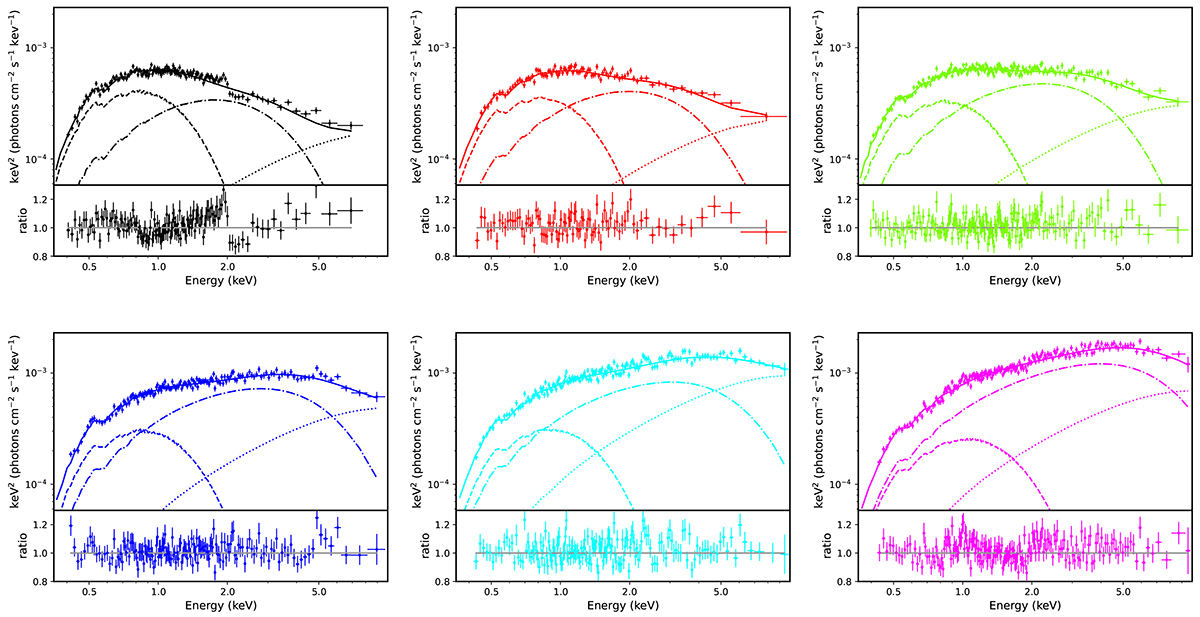
Fig. 8.
Download original image
Combined EPIC-pn + MOS(1,2) spectra of the six spectral states extracted from the HID (see text and Fig. 7). The colour convention is the same as indicated in Fig. 6-top. The best fit is given by the TBABS(DISKBB + DISKPBB + CUTOFFPL) model (see Table 2), where the DISKBB, DISKPBB and CUTOFFPL models are indicated with dashed, dot-dashed and dotted lines, respectively. In the bottom panel of each plot, it is shown the ratio of data and model.
Current usage metrics show cumulative count of Article Views (full-text article views including HTML views, PDF and ePub downloads, according to the available data) and Abstracts Views on Vision4Press platform.
Data correspond to usage on the plateform after 2015. The current usage metrics is available 48-96 hours after online publication and is updated daily on week days.
Initial download of the metrics may take a while.