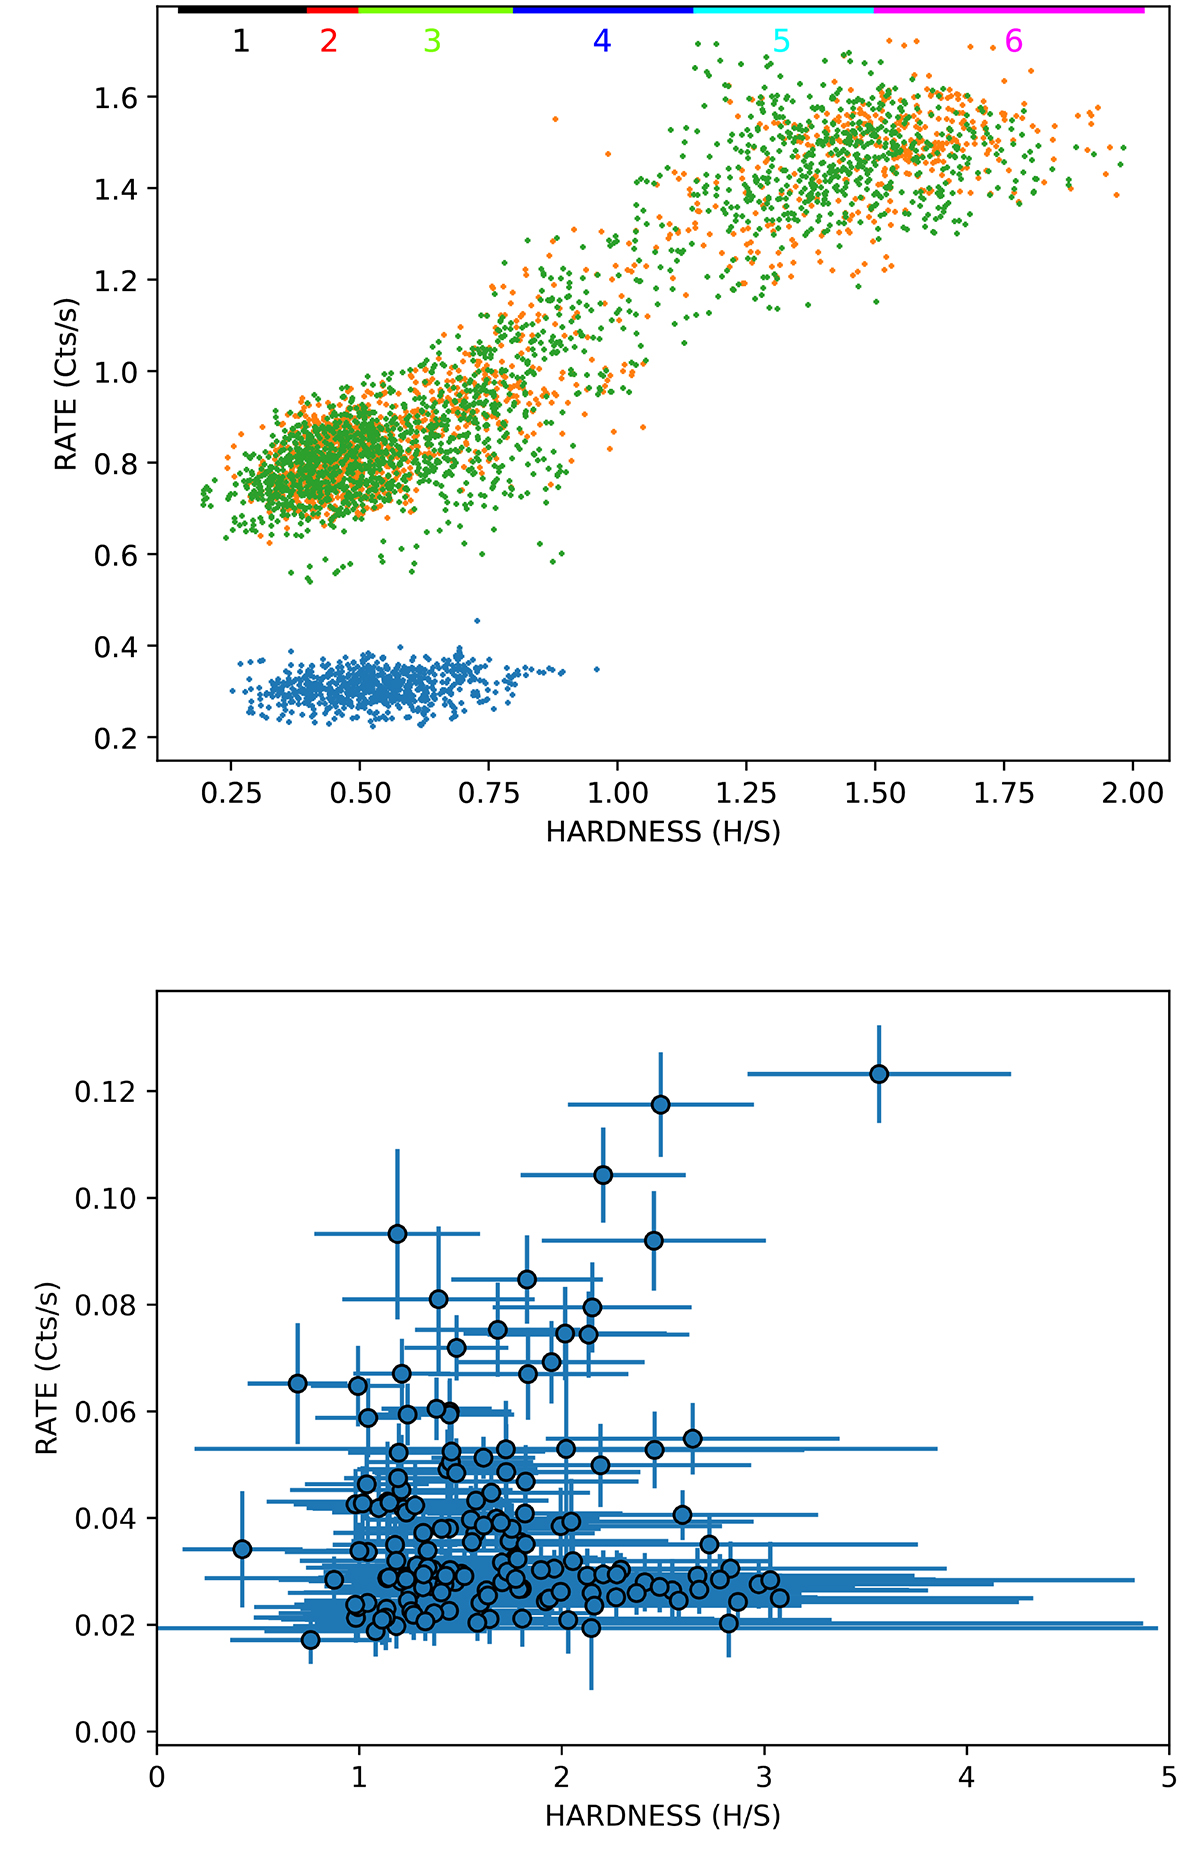
Fig. 6.
Download original image
Top: Hardness-intensity diagram for PN+MOS light curves of all XMM-Newton observations (after smoothing the data, see text). The data of the XMM0, XMM1 and XMM2 observations are reported in blue, orange and green, respectively. Hardness is defined as the ratio between the bands 2.0–10 keV (H) and 0.3–0.8 keV (S), while the rate is the sum of both bands. Smoothing with a moving window has been applied to the data (see text), and therefore we do not plot the errors on each point. The coloured and numbered segments on the top indicate the hardness ranges used for the spectra extraction shown in Fig. 8. Bottom: Hardness-intensity diagram for the available Swift/XRT data. Hardness is the ratio between the bands 1.0–10 (H) keV and 0.3–1.0 (S) keV.
Current usage metrics show cumulative count of Article Views (full-text article views including HTML views, PDF and ePub downloads, according to the available data) and Abstracts Views on Vision4Press platform.
Data correspond to usage on the plateform after 2015. The current usage metrics is available 48-96 hours after online publication and is updated daily on week days.
Initial download of the metrics may take a while.