Open Access
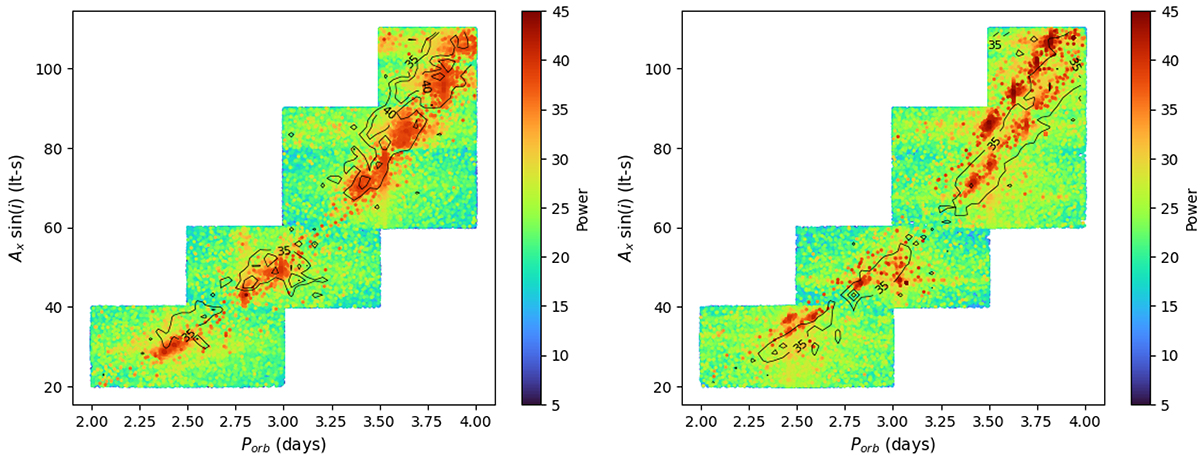
Fig. 5.
Download original image
Parameter space of the orbital parameters for the signal at 2.63s and 2.73s for XMM1 (left) and XMM2 (right), respectively. For displaying purposes only, in each plot the contours indicate the solution of the other observation. The colour bar indicates the Leahy power of the signal.
Current usage metrics show cumulative count of Article Views (full-text article views including HTML views, PDF and ePub downloads, according to the available data) and Abstracts Views on Vision4Press platform.
Data correspond to usage on the plateform after 2015. The current usage metrics is available 48-96 hours after online publication and is updated daily on week days.
Initial download of the metrics may take a while.