Fig. 3.
Download original image
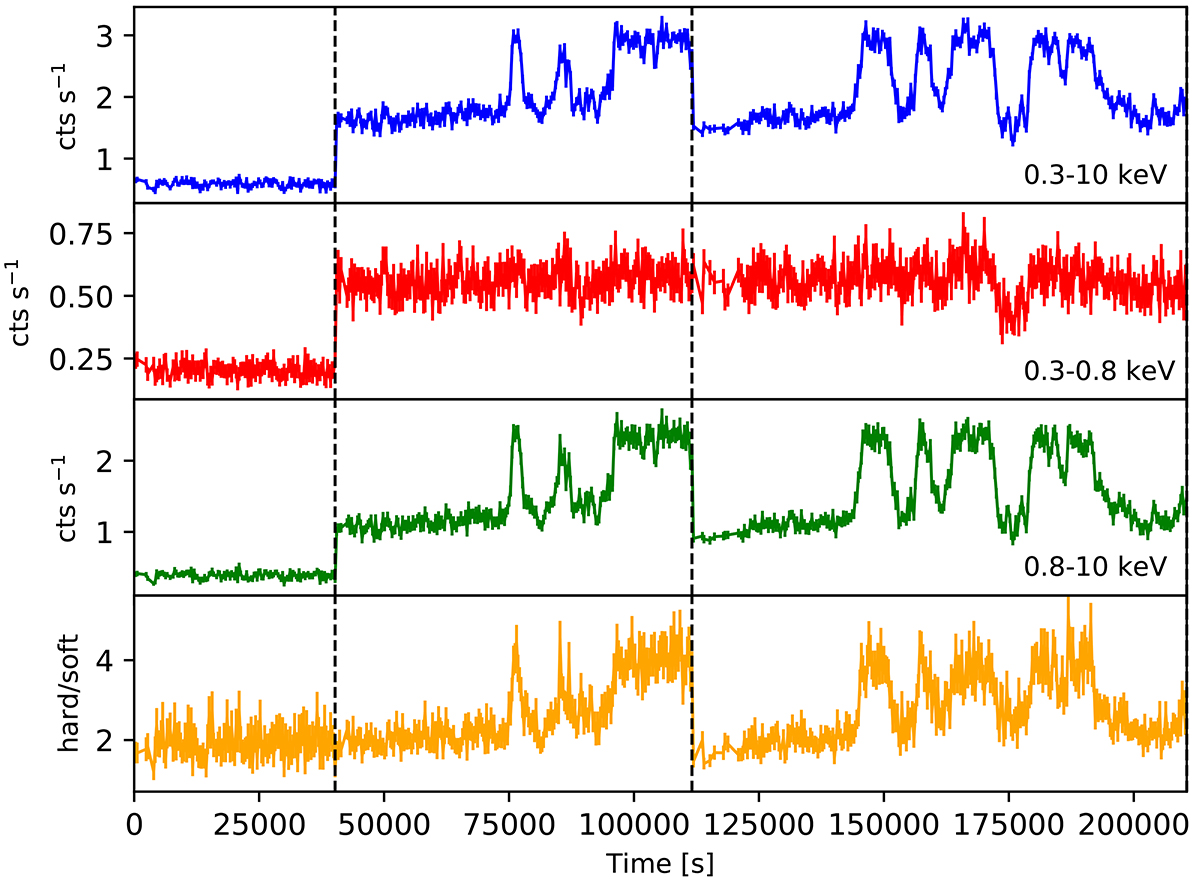
Background-subtracted light curve of X7 in XMM0, XMM1, and XMM2 (from left to right), binned at ΔT = 300 s (see the top-left legend), for the 0.3–10 keV (top panel), 0.3–0.8 keV (centre-top), and 0.8–10 keV (centre-bottom) energy bands. We also show the hardness ratio between the hard and the soft band (bottom panel). The dashed vertical lines divide the data between XMM0, XMM1, and XMM2, where the real time gaps between them were removed for displaying purposes only.
Current usage metrics show cumulative count of Article Views (full-text article views including HTML views, PDF and ePub downloads, according to the available data) and Abstracts Views on Vision4Press platform.
Data correspond to usage on the plateform after 2015. The current usage metrics is available 48-96 hours after online publication and is updated daily on week days.
Initial download of the metrics may take a while.