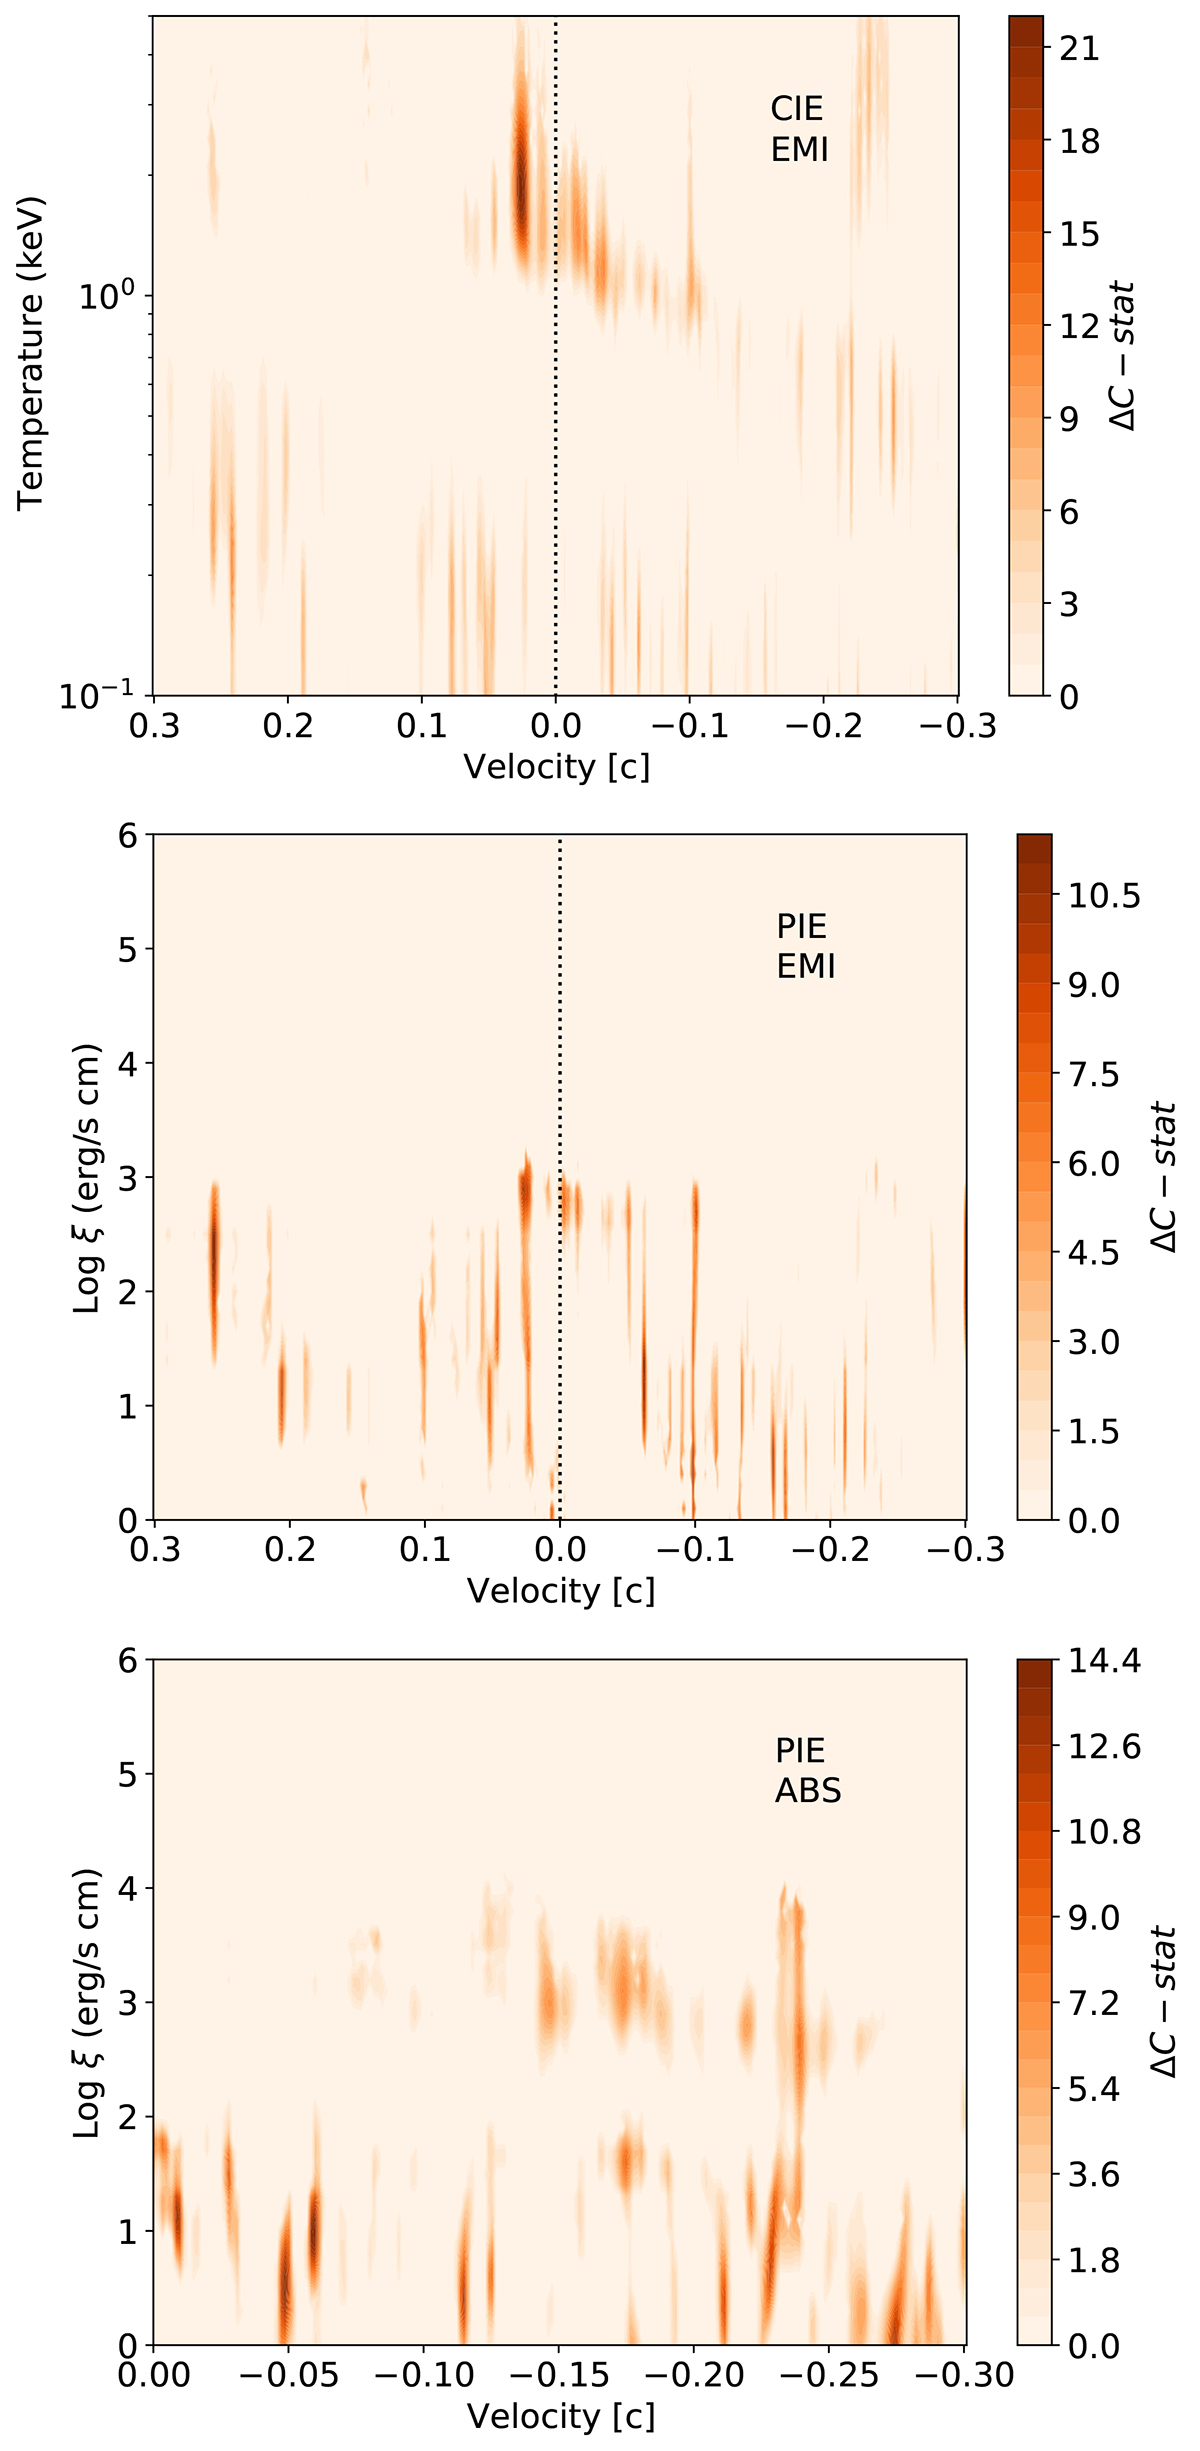
Fig. 13.
Download original image
Top panel: Multi-dimensional grids of emission models of plasma in collisionally ionisation equilibrium for the combined RGS (0.4–2 keV) and EPIC (2–10 keV) spectra. Middle and bottom panels: Grids of models of photoionised plasma in emission and absorption, respectively. Both scans adopted a line broadening of 100 km s−1 and solar abundances. The best-fit CIE model is also shown in Fig. 11.
Current usage metrics show cumulative count of Article Views (full-text article views including HTML views, PDF and ePub downloads, according to the available data) and Abstracts Views on Vision4Press platform.
Data correspond to usage on the plateform after 2015. The current usage metrics is available 48-96 hours after online publication and is updated daily on week days.
Initial download of the metrics may take a while.