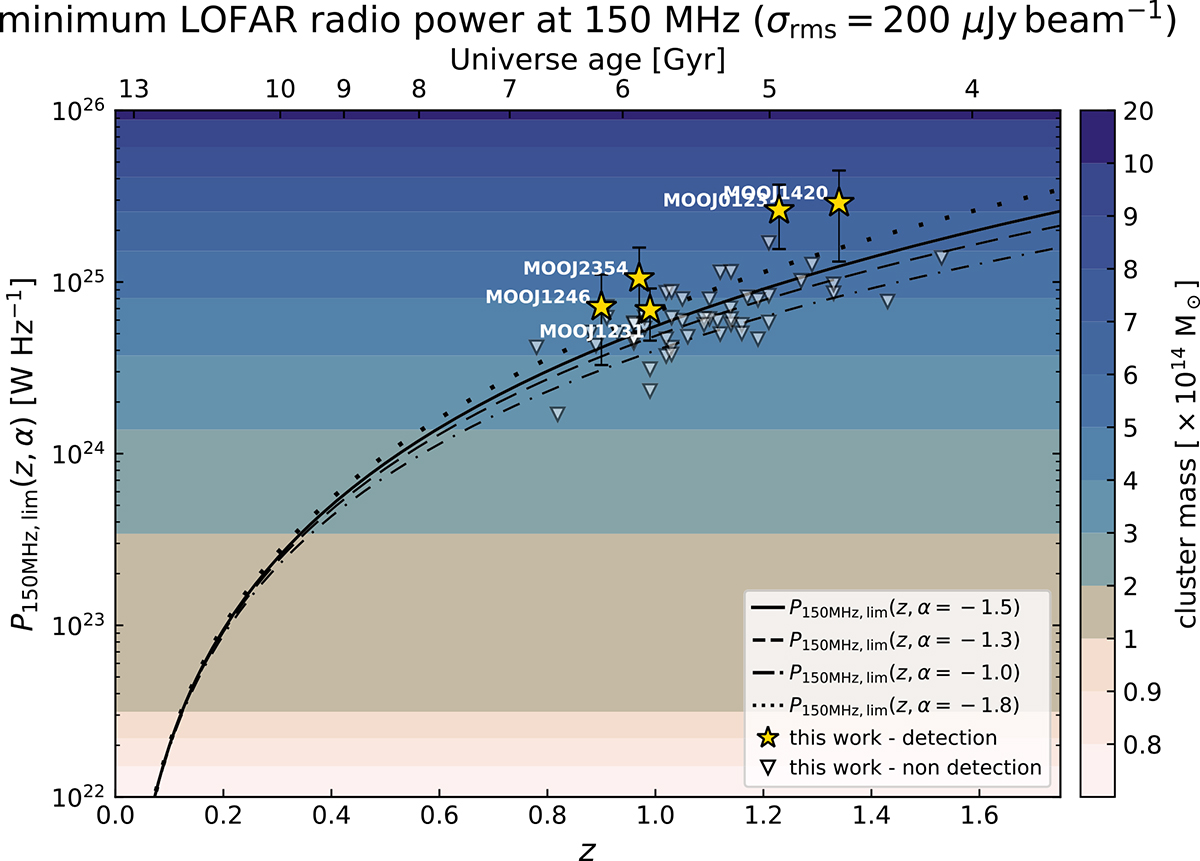
Fig. 7.
Download original image
Detection limit as a function of the redshift (z), as detectable by a standard LoTSS observation (Eq. (7)). Different lines show the dependence of the radio power on different spectral indices (solid, α = −1.5; dot-dashed, α = −1.0; dashed, α = −1.3; dotted, α = −1.8). The colour bar and the coloured bands refer to the mass that a galaxy cluster should have to lie exactly on the P150 MHz − M500 correlation found by Cuciti et al. (2023). Clusters from the MaDCoWS-LoTSS DR2 sample are also displayed (detections with golden stars, and non-detections with low-vertices triangles).
Current usage metrics show cumulative count of Article Views (full-text article views including HTML views, PDF and ePub downloads, according to the available data) and Abstracts Views on Vision4Press platform.
Data correspond to usage on the plateform after 2015. The current usage metrics is available 48-96 hours after online publication and is updated daily on week days.
Initial download of the metrics may take a while.