Fig. 6.
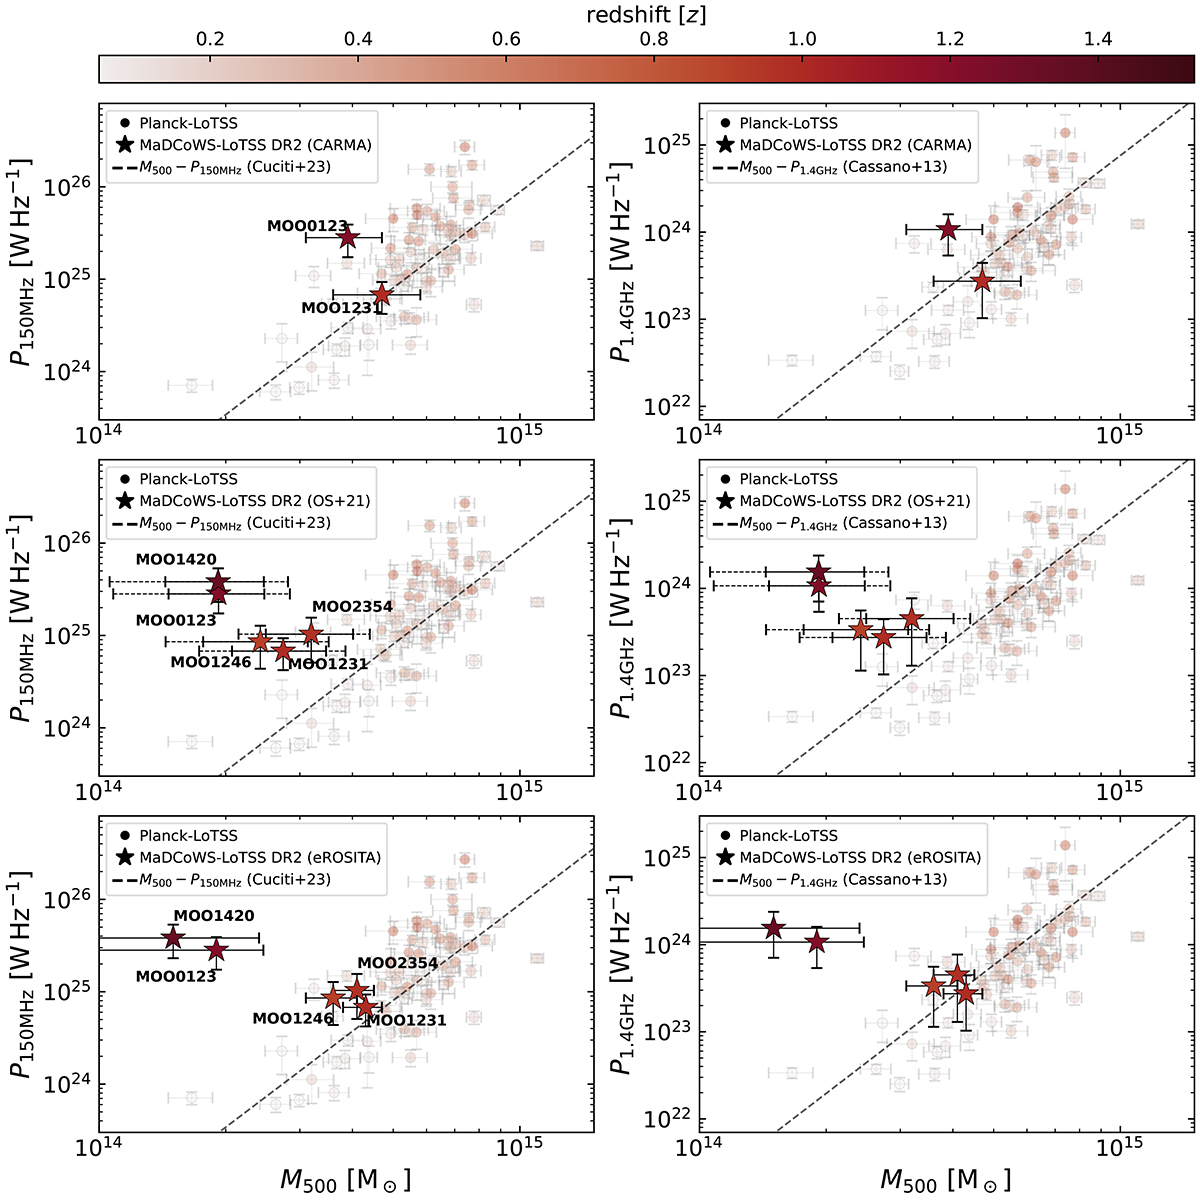
Download original image
Radio power versus mass diagrams (150 MHz, left column; 1.4 GHz, right column). Small shaded circles are from the literature at lower-redshifts (Di Gennaro et al. 2021a; Botteon et al. 2022), while stars display the detection from the MaDCoWS clusters in LoTSS-DR2 presented in this work. All markers are colour-coded according to their redshifts. We also display the Pν − M500 correlations found by Cuciti et al. (2023) and Cassano et al. (2013), at 150 MHz (left panels) and 1.4 GHz (right panles) respectively. Top row: masses from CARMA 30 GHz observations (Decker et al. 2019). Middle row: masses from the richness-mass scale relation calibrated with ACT clusters (Orlowski-Scherer et al. 2021, OS+21); solid errorbars reflect the uncertainties on the slope of the scale relation, while the dashed errorbars define the uncertainties associated with the scatter of the scale relation. Bottom row: masses from eROSITA observation.
Current usage metrics show cumulative count of Article Views (full-text article views including HTML views, PDF and ePub downloads, according to the available data) and Abstracts Views on Vision4Press platform.
Data correspond to usage on the plateform after 2015. The current usage metrics is available 48-96 hours after online publication and is updated daily on week days.
Initial download of the metrics may take a while.