Fig. 5.
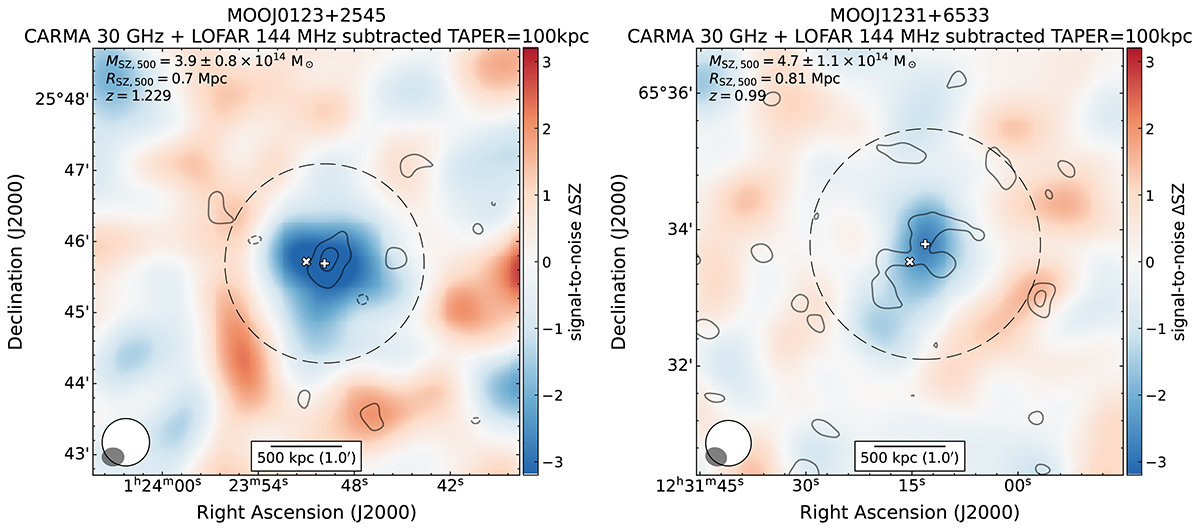
Download original image
CARMA 30 GHz observations (Decker et al. 2019) with radio source-subtracted LOFAR low-resolution contours of the available MaDCoWS clusters in LoTSS-DR2. The different beam sizes are shown the on the bottom left corner of each panel, with the solid grey corresponding to LoTSS-DR2 and open white to the CARMA 30 GHz data. The colour map represents the SZ variation in units of signal-to-noise, therefore negative values reveal the presence of the cluster (with the centre marked by the white ‘plus’; Decker et al. 2019). The black circle places the R500 area given the SZ coordinates, and the white cross provides the MaDCoWS centre (Gonzalez et al. 2019). The cluster mass, R500 and redshift from the CARMA observations are indicated in the upper left corner of each panel.
Current usage metrics show cumulative count of Article Views (full-text article views including HTML views, PDF and ePub downloads, according to the available data) and Abstracts Views on Vision4Press platform.
Data correspond to usage on the plateform after 2015. The current usage metrics is available 48-96 hours after online publication and is updated daily on week days.
Initial download of the metrics may take a while.