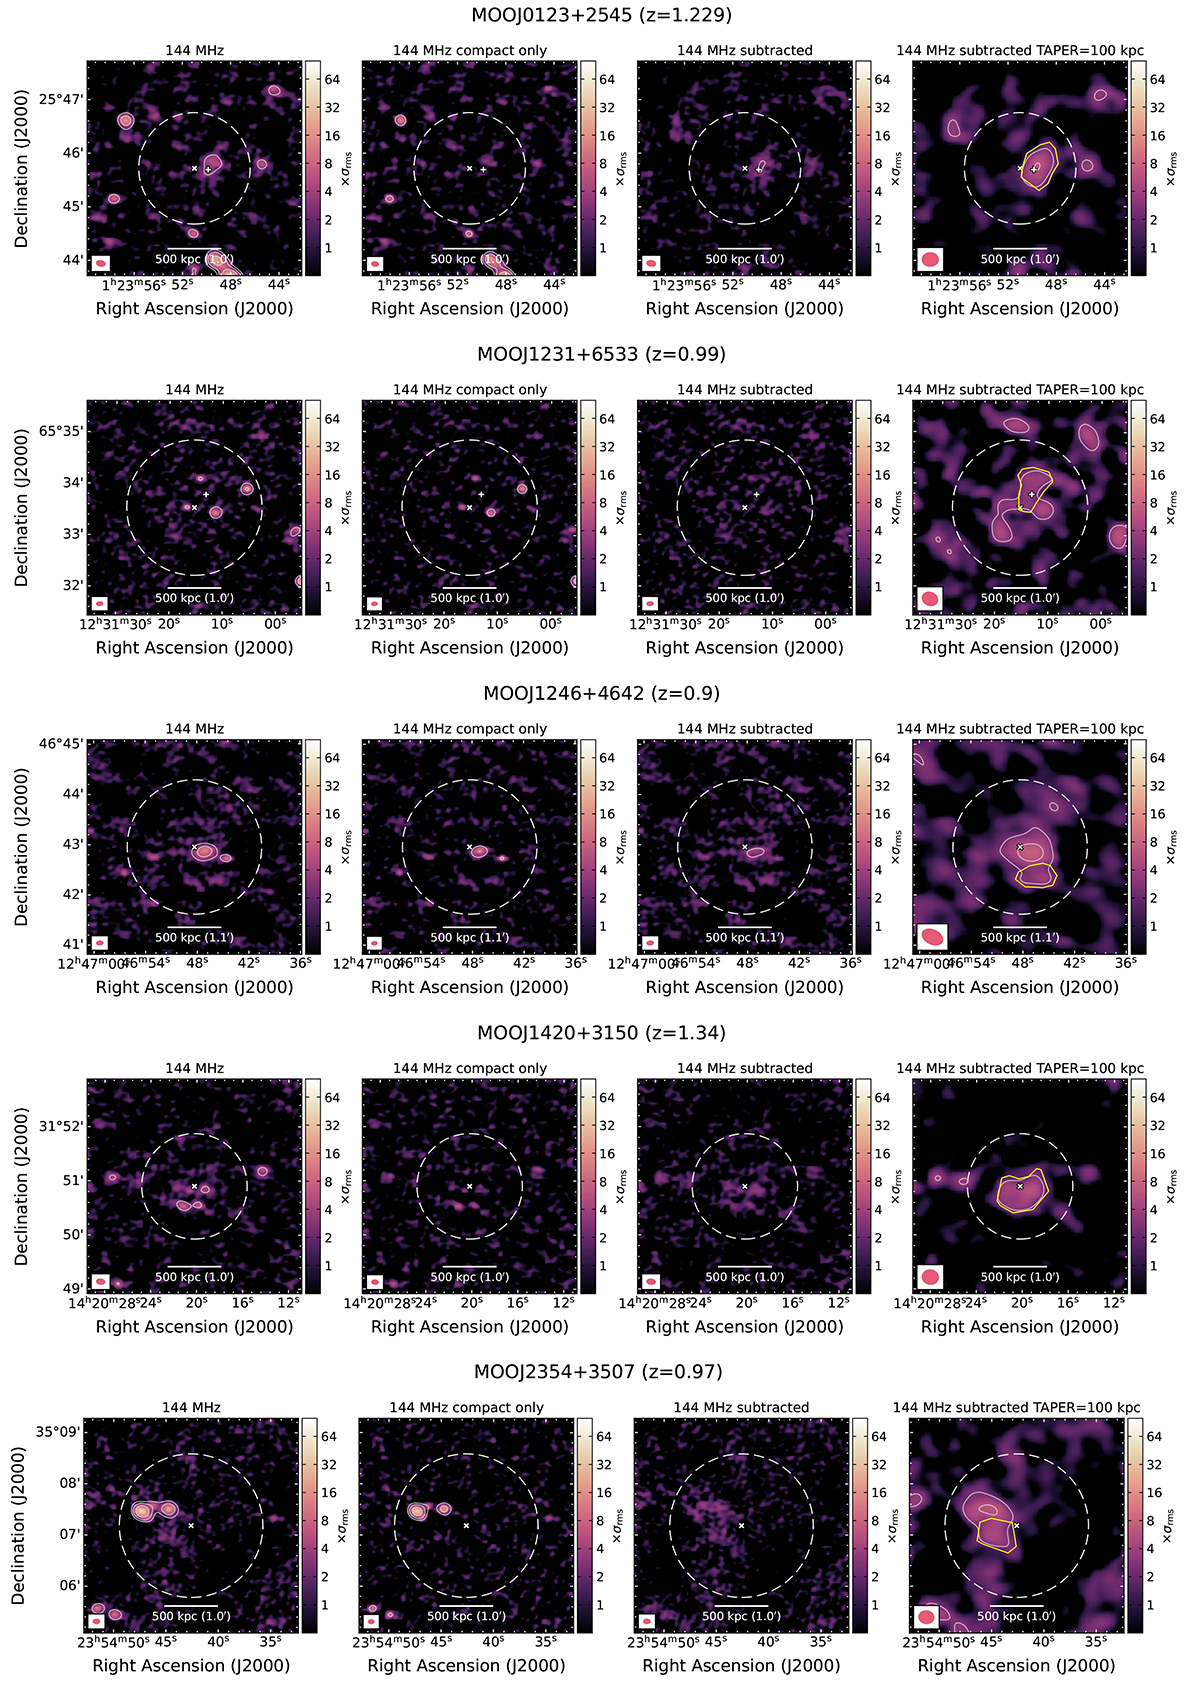
Fig. 4.
Download original image
LOFAR 144 MHz images of the MaDCoWS clusters with cluster-scale diffuse emission. The cluster name and redshift are stated at the top of each row. From left to right: full-resolution image; full resolution, compact only (i.e. after applying an inner uv-cut of 400 kpc; full-resolution source-subtracted image; same as previous panel, but with taper=100kpc. Yellow regions in the right panel of each row show the area where we measure the radio flux densities. Radio contours are displayed in white, solid lines, starting from 2.5σrms × [2, 4, 8, 16, 32] and negative contours at −2.5σrms are shown in white, dashed lines. The beam shape is shown at the bottom left corner of each panel. The dashed white circle shows the R500 kpc area, with the cross marking the MaDCoWS coordinates reported by Gonzalez et al. (2019) and, when available, the plus marking the peak of the CARMA SZ observation (Decker et al. 2019).
Current usage metrics show cumulative count of Article Views (full-text article views including HTML views, PDF and ePub downloads, according to the available data) and Abstracts Views on Vision4Press platform.
Data correspond to usage on the plateform after 2015. The current usage metrics is available 48-96 hours after online publication and is updated daily on week days.
Initial download of the metrics may take a while.