Open Access
Fig. 3.
Download original image
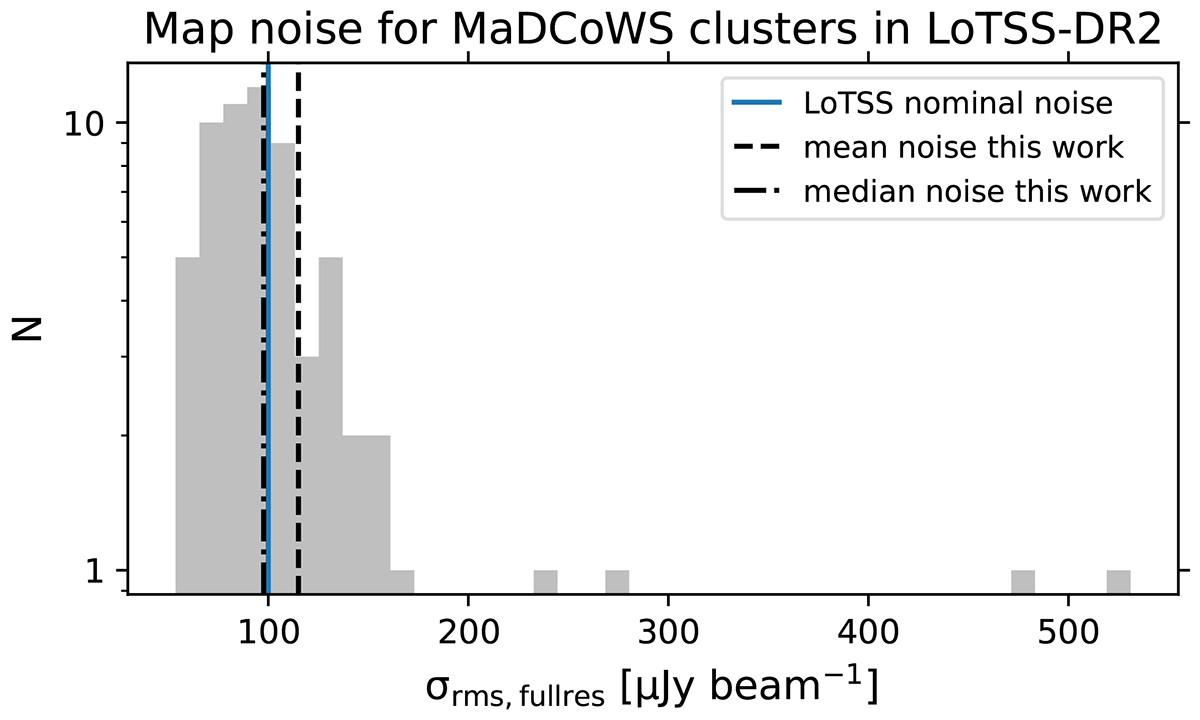
Distribution of the map noise of the MaDCoWS clusters in LoTSS-DR2. The blue, solid line shows the nominal map noise from LoTSS, while the dot-dashed and dashed lines represent the median and mean values, respectively, for the 144 MHz cluster images in this work.
Current usage metrics show cumulative count of Article Views (full-text article views including HTML views, PDF and ePub downloads, according to the available data) and Abstracts Views on Vision4Press platform.
Data correspond to usage on the plateform after 2015. The current usage metrics is available 48-96 hours after online publication and is updated daily on week days.
Initial download of the metrics may take a while.