Fig. 2.
Download original image
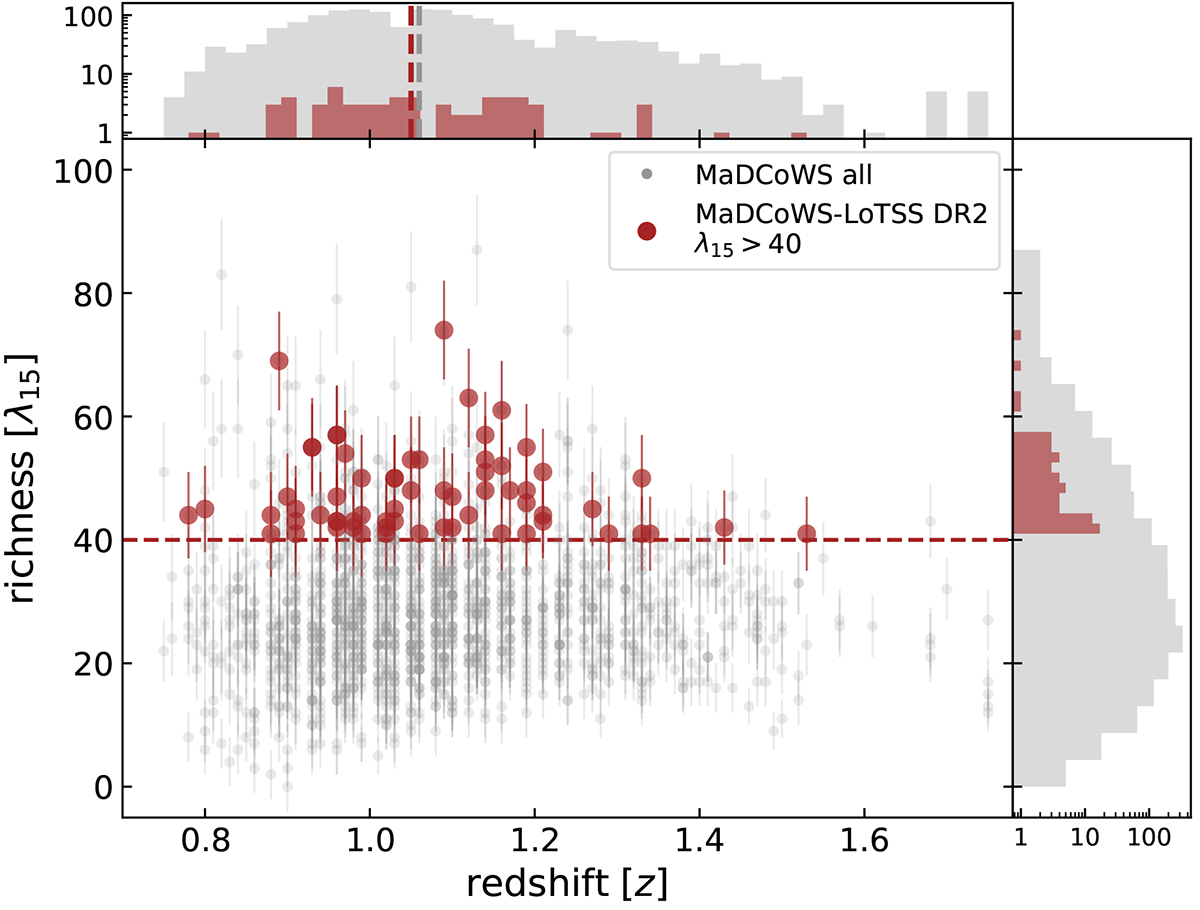
Redshift-richness distribution of all the MaDCoWS clusters (small grey dots). The red, filled circles display the clusters in our sample (i.e. with λ15 > 40, see dashed line). The histograms on the top and on the right show their distribution in comparison with the full MaDCoWS sample. Dashed grey and red lines in the top-panel histogram show the median redshift of the two distributions (⟨zall⟩∼1.06 and ⟨zLoTSS⟩∼1.05, respectively).
Current usage metrics show cumulative count of Article Views (full-text article views including HTML views, PDF and ePub downloads, according to the available data) and Abstracts Views on Vision4Press platform.
Data correspond to usage on the plateform after 2015. The current usage metrics is available 48-96 hours after online publication and is updated daily on week days.
Initial download of the metrics may take a while.