Fig. 3
Download original image
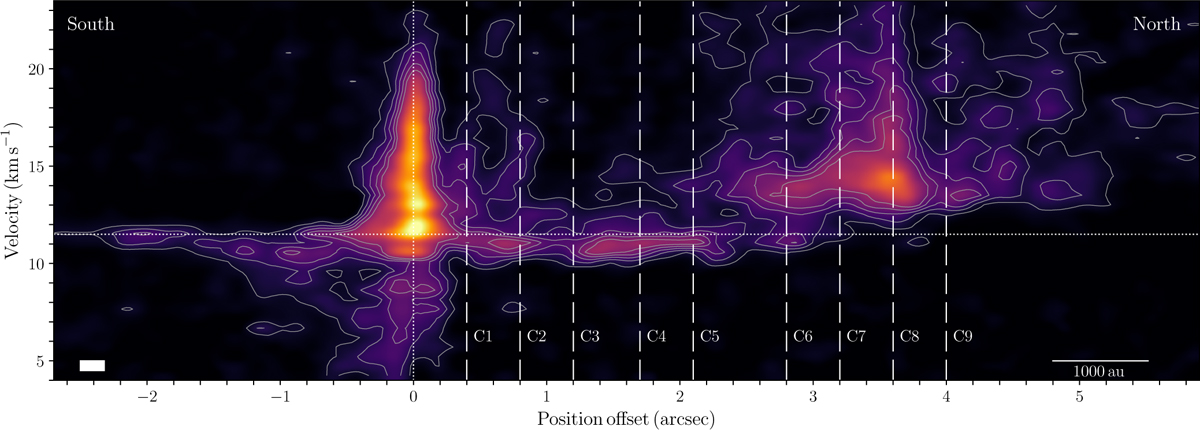
PV diagram of the H2CO emission along the outflow axis. This orientation of the axis was estimated by joining the peak of the MM2(E) continuum emission and the position of the MC source. Dotted lines mark the position of the source (vertical) and the velocity of the system, Vsys ≃ 11.5 km s−1 (horizontal). Vertical dashed lines indicate the position where the perpendicular PV diagrams are made (see Fig. 4). The contour levels start at 2σ and are in steps of 2σ, 4σ, 6σ, and 8σ, where σ = 2.1 mJy beam−1. The white bar represents the angular resolution ![]() and the channel width (0.5 km s−1).
and the channel width (0.5 km s−1).
Current usage metrics show cumulative count of Article Views (full-text article views including HTML views, PDF and ePub downloads, according to the available data) and Abstracts Views on Vision4Press platform.
Data correspond to usage on the plateform after 2015. The current usage metrics is available 48-96 hours after online publication and is updated daily on week days.
Initial download of the metrics may take a while.