Fig. 9
Download original image
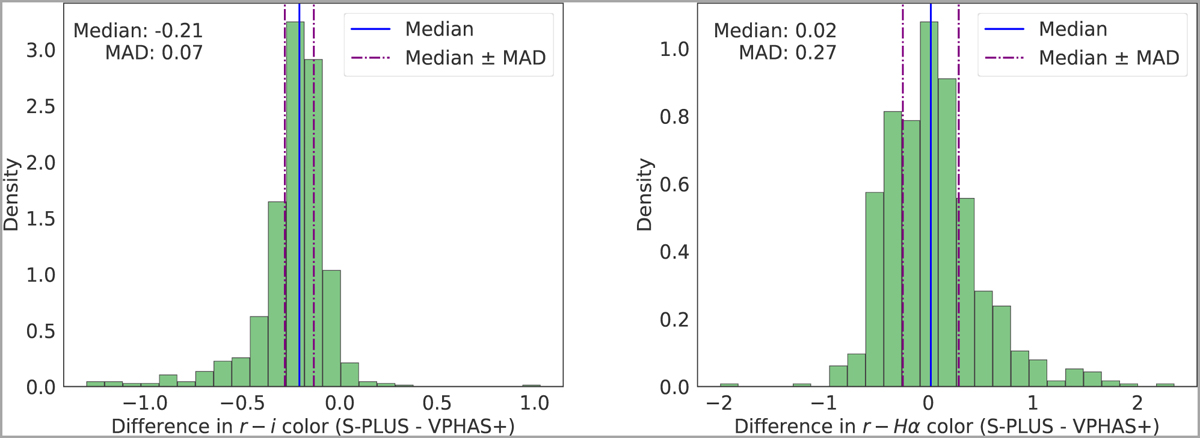
Histograms illustrating the discrepancies in the photometric colours (r – i) and (r – Hα) between the S-PLUS and VPHAS+ surveys. The left panel depicts the differences in the (r – i) colour, while the right panel shows the differences in the r – Hα colour. The histograms reveal significant differences for the stars included in the two surveys. The median value and median absolute deviation (MAD) for each colour discrepancy are provided, offering insights into the agreement between the two datasets.
Current usage metrics show cumulative count of Article Views (full-text article views including HTML views, PDF and ePub downloads, according to the available data) and Abstracts Views on Vision4Press platform.
Data correspond to usage on the plateform after 2015. The current usage metrics is available 48-96 hours after online publication and is updated daily on week days.
Initial download of the metrics may take a while.