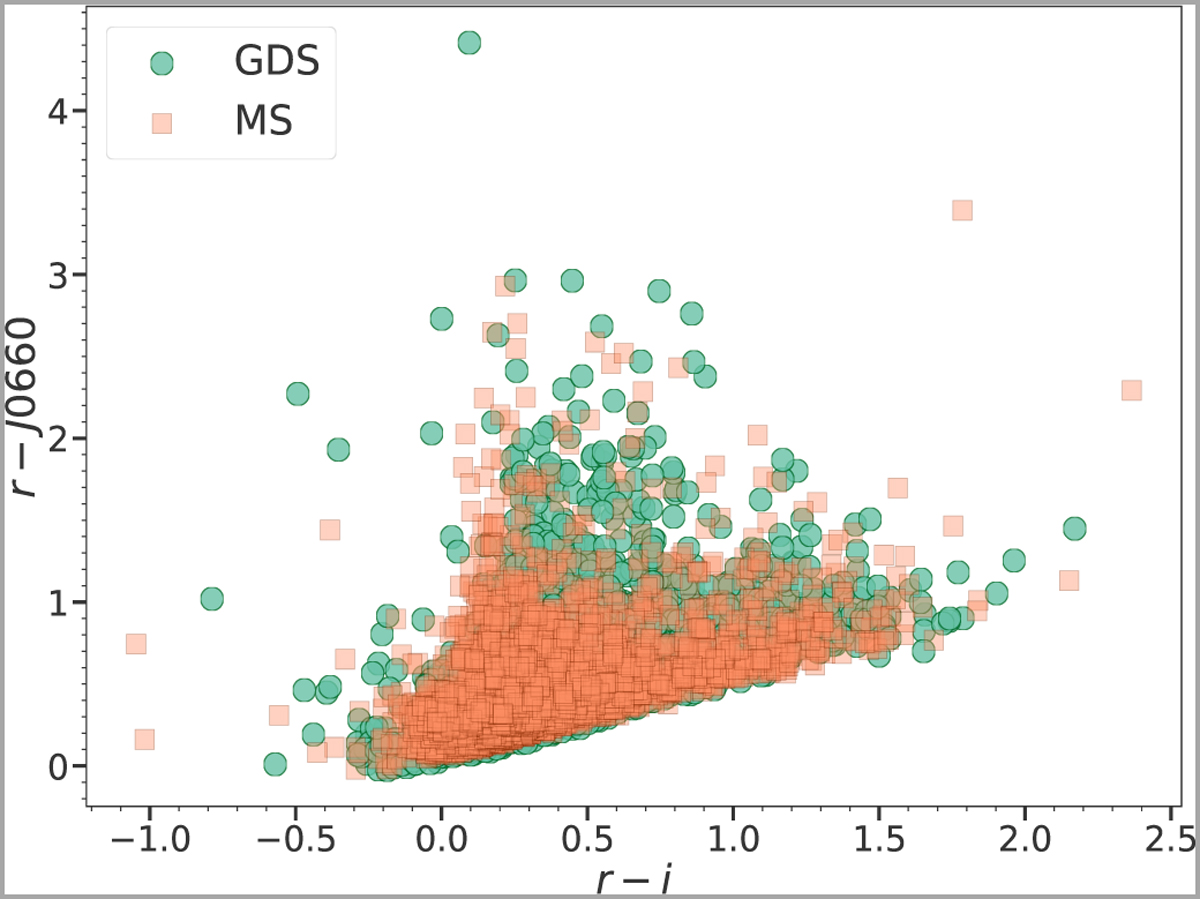
Fig. 4
Download original image
Colour–colour diagram shows the distribution of Hα-feature sources in the (r – J0660) versus (r – i) colour–colour space. The data is divided into two populations: GDS and MS representing distinct galactic components. The GDS population, depicted by the filled circles (in green), corresponds to Hα excess sources associated with disk structures. In contrast, the MS population, represented by the squares (in orange), includes Hα excess sources primarily located in the direction of the Galactic halo and extragalactic sources.
Current usage metrics show cumulative count of Article Views (full-text article views including HTML views, PDF and ePub downloads, according to the available data) and Abstracts Views on Vision4Press platform.
Data correspond to usage on the plateform after 2015. The current usage metrics is available 48-96 hours after online publication and is updated daily on week days.
Initial download of the metrics may take a while.